FIGURE 1.

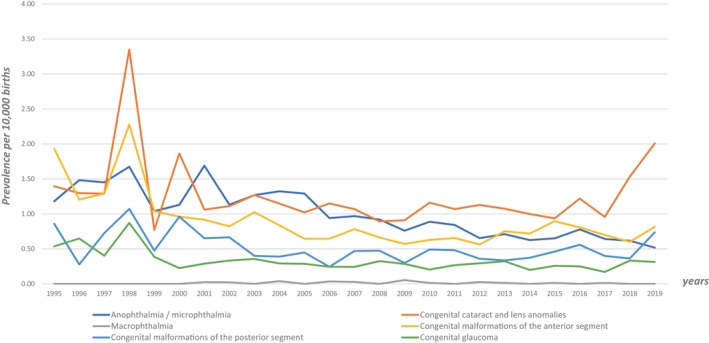
Prevalence (per 10,000 births) of congenital ocular anomaly (COA) with and without genetic anomalies over time (red curve: COA prevalence excluding genetic anomalies; blue curve: COA prevalence including genetic anomalies).

Prevalence (per 10,000 births) of congenital ocular anomaly (COA) with and without genetic anomalies over time (red curve: COA prevalence excluding genetic anomalies; blue curve: COA prevalence including genetic anomalies).