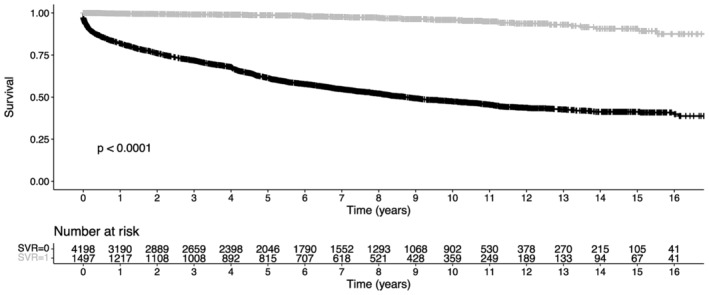
FIGURE 4.

Comparison of Kaplan–Meier curves of individuals who achieved versus did not achieve sustained virological response (SVR).

Comparison of Kaplan–Meier curves of individuals who achieved versus did not achieve sustained virological response (SVR).