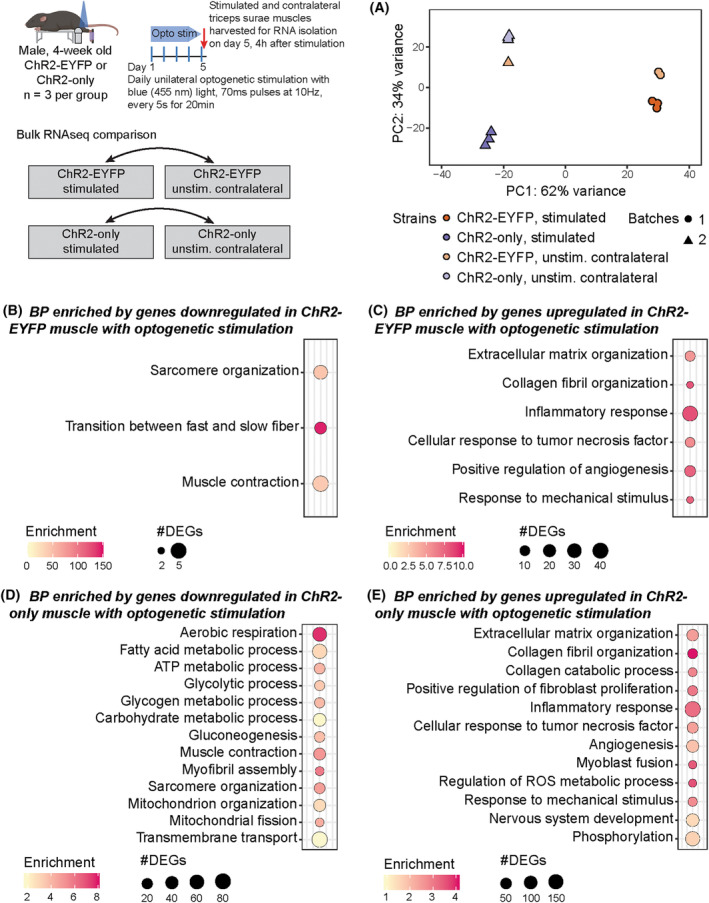
FIGURE 8.

Repeated bouts of optogenetic stimulation led to a more robust transcriptional response in ChR2‐only muscle compared with ChR2‐EYFP muscle. (A) Principal component analysis of gene expression. Shapes indicate different sequencing batches. Biological processes obtained from genes (B) downregulated and (C) upregulated in ChR2‐EYFP stimulated muscle and (D) downregulated and (E) upregulated in ChR2‐only stimulated muscle compared with unstimulated contralateral muscle. n = 3 per group.
