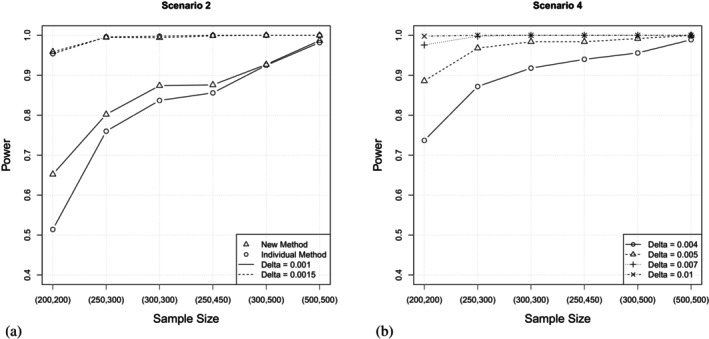
FIGURE 2.

(a) Scenario 2, constant intensities, : Power of the new method and the individual method [18] in dependence of the sample size for different similarity thresholds. (b) Scenario 4, Gompertz and Weibull distributed intensities, : Power of the new method in dependence of the sample size for different similarity thresholds. As Scenario 2 and Scenario 4 assume different underlying distributions, different similarity thresholds are considered for a meaningful analysis.
