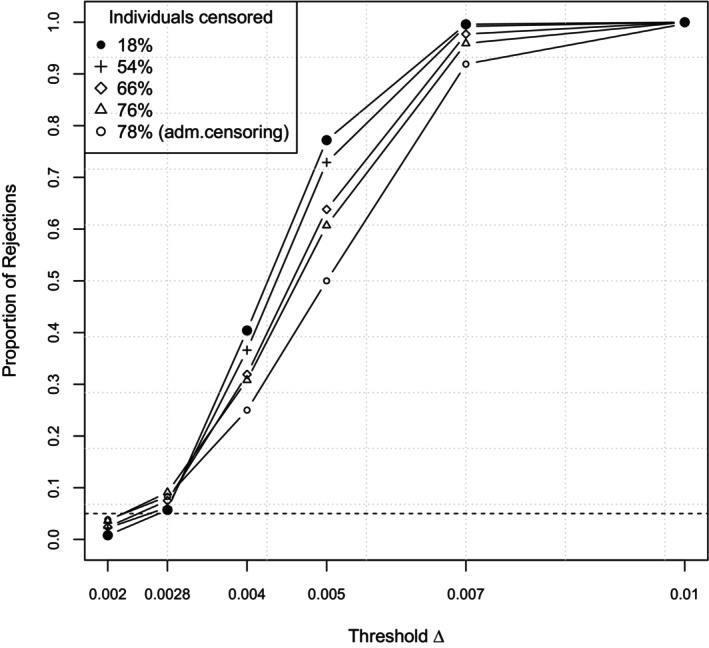
FIGURE 3.

Scenario 3: Proportion of rejections for different amounts of censoring at a fixed sample size of in dependence of the threshold. The first two thresholds correspond to the null hypothesis (where the second one displays the margin situation), the last four to the alternative. The dashed line indicates the nominal level .
