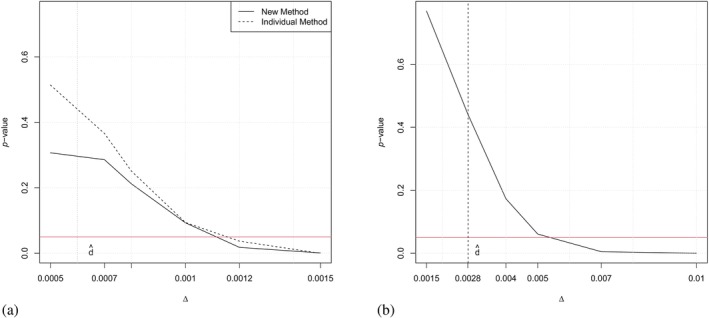
FIGURE 6.

(a) p Values of the test described in Algorithm 1 (new method, solid line) compared with the individual method [18] (dashed line) for the application example assuming constant intensities, in dependence of the threshold . (b) p Values of the test described in Algorithm 1 assuming a Gompertz/Weibull model in dependence of the threshold . The horizontal line indicates a p value of 0.05, the vertical line indicates the test statistic .
