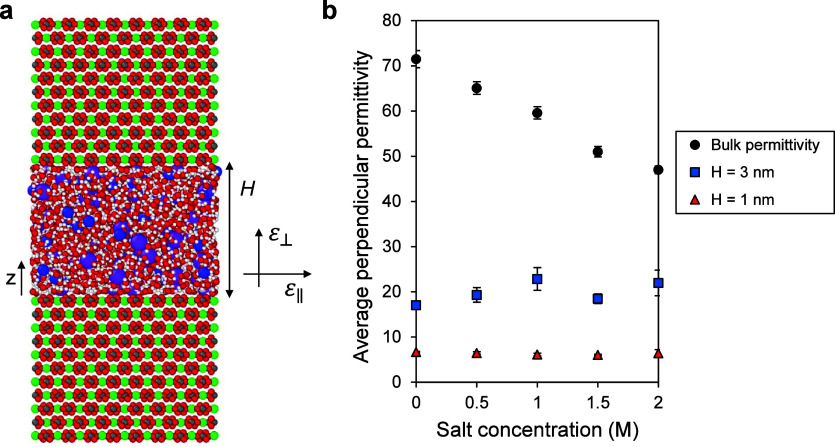
Figure 1.
Saline water in nanoconfinement. (a) A snapshot of the simulation setup illustrating water molecules, Na+ and Cl– ions (c = 2 M), between two calcite slabs separated by a distance of 3 nm. Atom colors: O—red, H—white, Na+—purple, Cl–—blue, Ca—green, C—dark gray. (b) Average perpendicular permittivity within channels of varying heights (H = 1 and 3 nm) as a function of NaCl concentration. Nanoconfined results are compared with the dielectric permittivity of bulk saline water obtained from MD simulations. The bulk water permittivity data points are adopted from Seal et al.60

