. 2024 Nov 19;15(48):20545–20555. doi: 10.1039/d4sc06470d

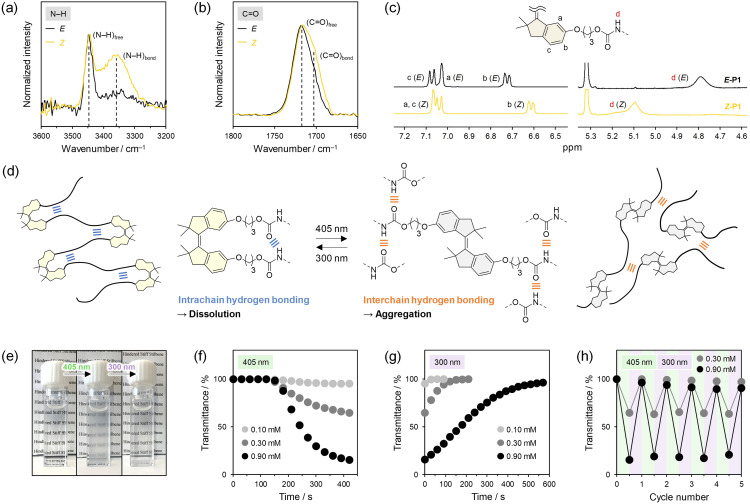
Fig. 5. FTIR spectra of E-P1 and Z-P1 in DCM (100 mg mL−1) focused on (a) N–H and (b) C Created by potrace 1.16, written by Peter Selinger 2001-2019 O stretching vibrations. (c) 1H NMR spectra (500 MHz) of E-P1 and Z-P1 in CD2Cl2. (d) Illustration of intrachain and interchain hydrogen bonding in Z-P1 and E-P1, respectively. (e) Pictures of photoreversible precipitation and dissolution of Z-P1 in toluene (0.90 mM) by 405 nm irradiation for 7 min and subsequent 300 nm irradiation for 9.5 min. Transmittance changes of toluene solutions of Z-P1 at 0.10, 0.30, and 0.90 mM during (f) 405 nm irradiation and (g) subsequent 300 nm irradiation. (h) Transmittance changes of toluene solutions of Z-P1 at 0.30 and 0.90 mM upon alternating irradiation with 405 and 300 nm light.

Fig. 5