. 2024 Nov 8;12:RP90695. doi: 10.7554/eLife.90695

Figure 2. Profiling of genes differentially expression between differentiated microglial cells vs. myeloid progenitor cells (MPCs) using bulk RNAseq analysis.

(A) Volcano plot showing representative genes that were either upregulated (red) or downregulated (green) in differentiated microglia vs. MPCs. (B) Heat map showing increased expression of microglia-enriched genes in differentiated microglia (Supplementary file 1). (C) Histogram comparing the expression levels of microglia-enriched genes in terms of Fragments Per Kilobase of transcript per Million mapped reads (FPKM). *p < 0.05. (D) Histogram comparing expression levels of myeloid cell lineage genes in human-induced pluripotent stem cell (iPSC)-derived MPC and microglia cells using FPKM. *p < 0.05. (E) Graphic signaling pathway analysis with Ingenuity Pathway Analysis (IPA) highlighting IL6 and IL1B as signaling hubs in differential gene expression patterns (Supplementary file 1) in differentiated microglia vs. MPCs.

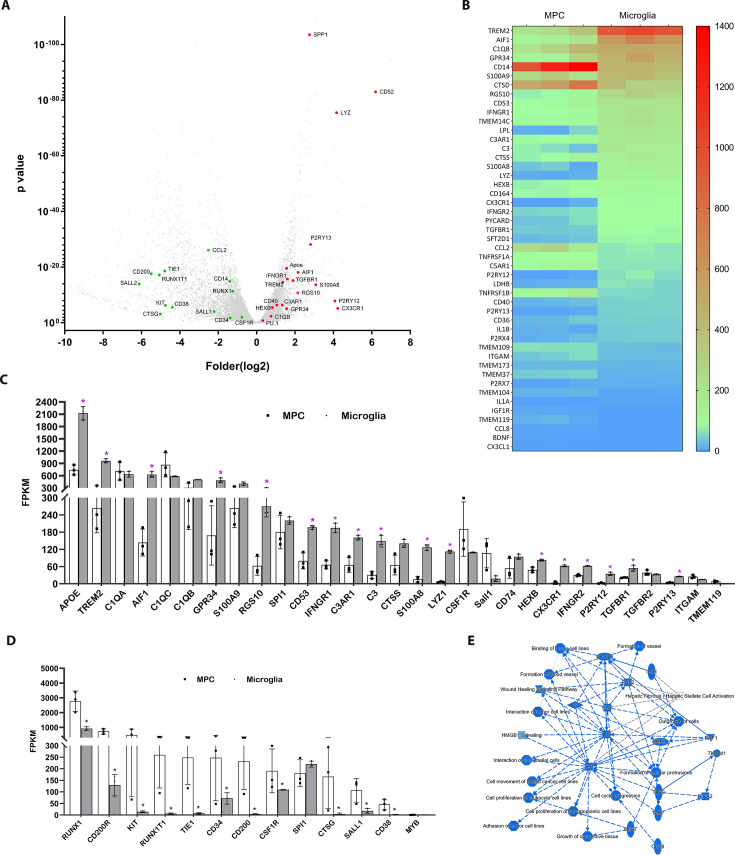
Figure 2.

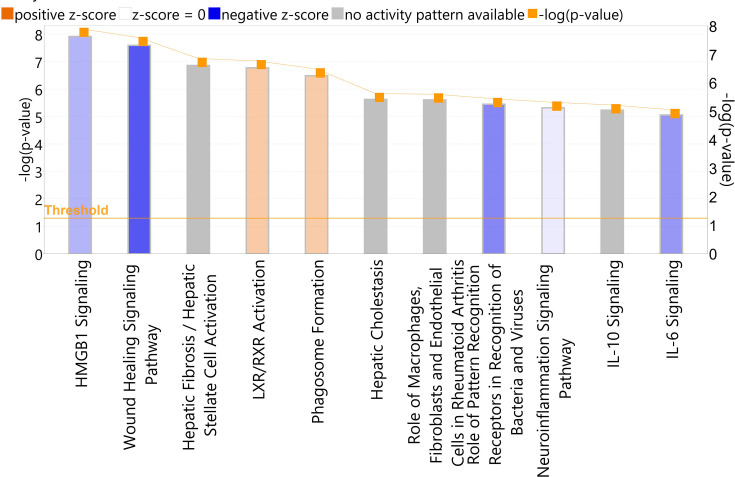
Figure 2—figure supplement 1. Analysis results of the canonical pathway of complete differentiated human-induced pluripotent stem cell (hiPSC)-derived microglia vs. myeloid progenitor cells with Ingenuity Pathway Analysis (IPA) with the enriched microglia genes (Supplementary file 1).

Figure 2—figure supplement 1.

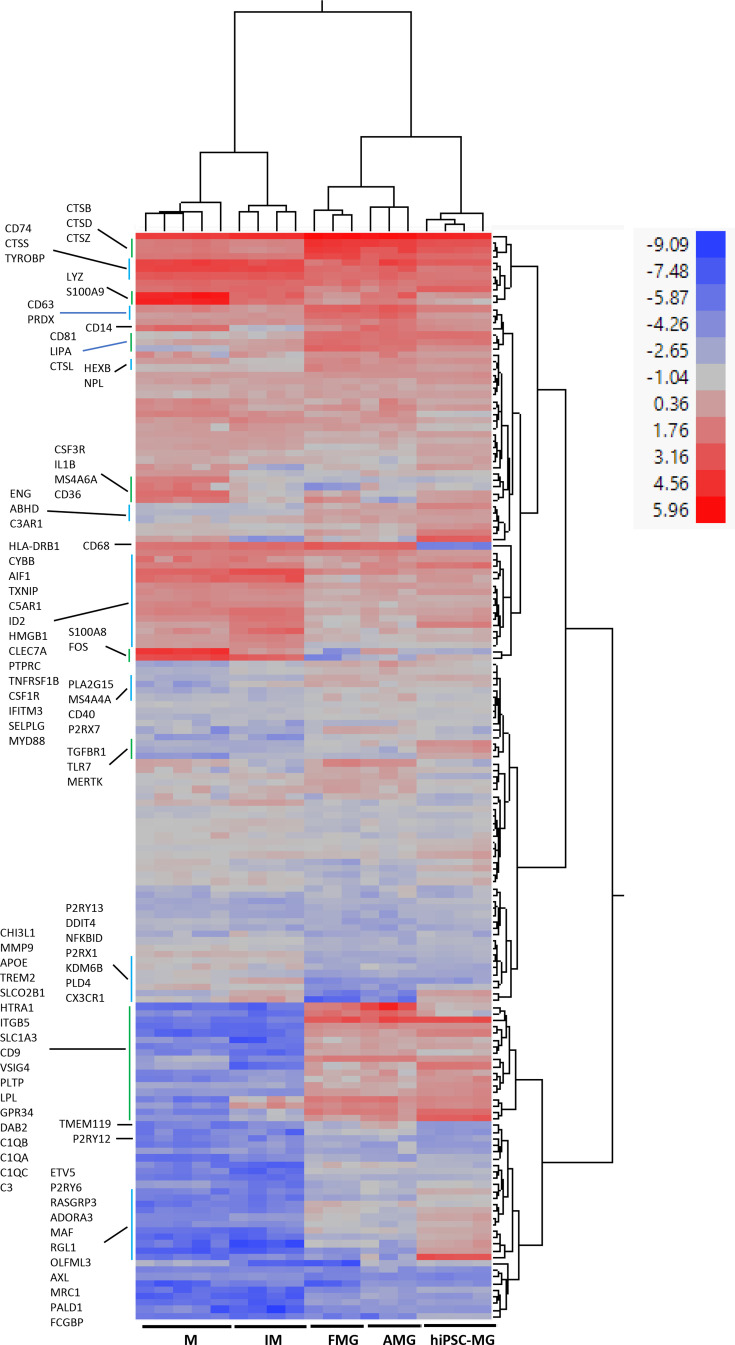
Figure 2—figure supplement 2. Hierarchical cluster analysis on microglia-enriched genes among human-induced pluripotent stem cell (hiPSC)-derived microglial cells (hiPSC-MG) and human adult brain microglia cells (AMG), fetal brain microglia cells (FMG), inflammatory monocytes (IM), monocytes (M).

Figure 2—figure supplement 2.

The human microglia gene panel combined our mouse microglia-enriched genes and human microglia-enriched genes (Abud et al., 2017; Muffat et al., 2016; Douvaras et al., 2017; Böttcher et al., 2019; van der Poel et al., 2019). The total microglia-enriched gene list contains 203 genes (Supplementary file 2), which used to be extracted from the gene profile of human-induced pluripotent stem cell (hiPSC)-MG and downloaded human adult microglia (AMG), fetal microglia (FMG), inflammatory monocyte (IM) and monocytes (M) (GSE 178846, Abud et al., 2017). 188 genes (Supplementary file 2) were obtained from both gene lists. All the gene counts were normalized with four human cells housekeeping genes C1orf43, RAB7A, REEP5, and VCP (Eisenberg and Levanon, 2013). The hierarchical cluster was analyzed by JMP (JMP Statistical Discovery LLC). Results showed that hiPSC-MG is more comparable with AMG and FMG.
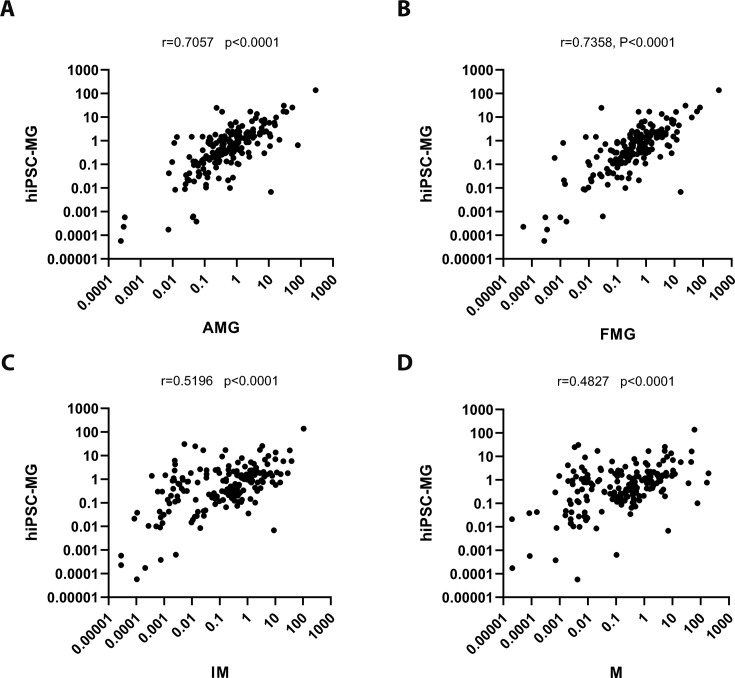
Figure 2—figure supplement 3. Correlation analysis between the expression levels of microglia-enriched genes in human-induced pluripotent stem cell (hiPSC)-derived microglia cells (hiPSC-MG) vs. those in other myeloid cells.

Figure 2—figure supplement 3.

The correlation analysis of 188 human microglia-enriched genes (Supplementary file 2) among human-induced pluripotent stem cell (hiPSC)-derived microglia cells (hiPSC-MG), human adult brain microglia (AMG) cells (A), fetal brain microglia (FMG) cells (B), inflammatory monocytes (IM) (C), and monocytes (M) (D) (GSE 178846, Abud et al., 2017), respectively. The images and the analysis results (Prism, GraphPad) showed that expression levels of microglia-enriched genes in hiPSC-MG are more correlated between those in FMG (r = 0.7358, p < 0.0001) and AMG (r = 0.7057, p < 0.0001).
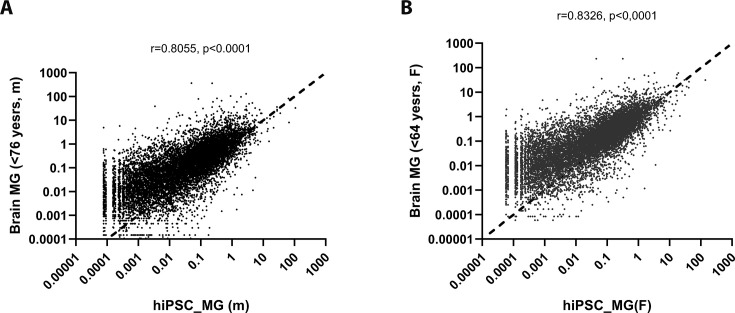
Figure 2—figure supplement 4. Correlation analysis between the expression levels of genes in human-induced pluripotent stem cell (hiPSC)-derived microglia cells (hiPSC-MG) vs. human donor brain microglia by sex.

Figure 2—figure supplement 4.

Correlation comparison of entire gene profiles between male (A)/female (B) human-induced pluripotent stem cell (hiPSC)-derived microglial cells and male (A)/female (B) human brain microglia cells (GSE 111972, van der Poel et al., 2019; Supplementary file 3), respectively. The results showed they are significantly correlative (r = 0.8055 (M), r = 0.8326 (F), p < 0.0001).