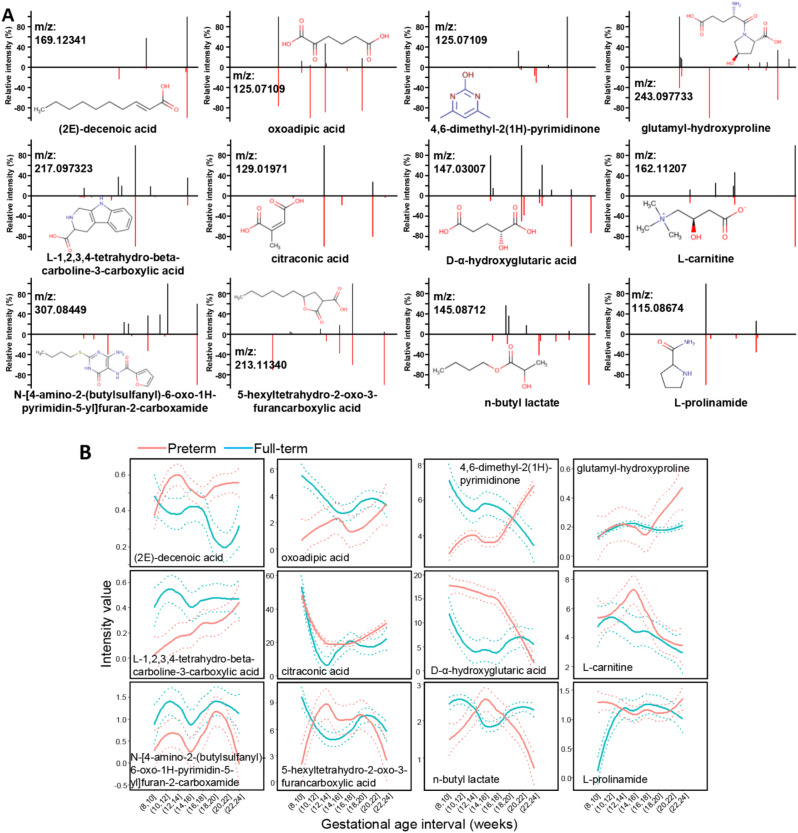
Fig. 4.
Characterization of the metabolite biomarkers. (A) The structural identification of the 12 metabolites by MS/MS fragmentation against reference compound standards. Measured MS/MS spectral fragmentation profiles (top, black lines) matching chemical standards (bottom, red lines). (B) PTB metabolite biomarkers with unique urinary abundance patterns along gestation. The mean levels (solid lines) with the 95% CIs (dotted lines) of the metabolite changes against the gestational progression of the 8th and 24th weeks are shown for preterm (red) and full-term (blue) births

