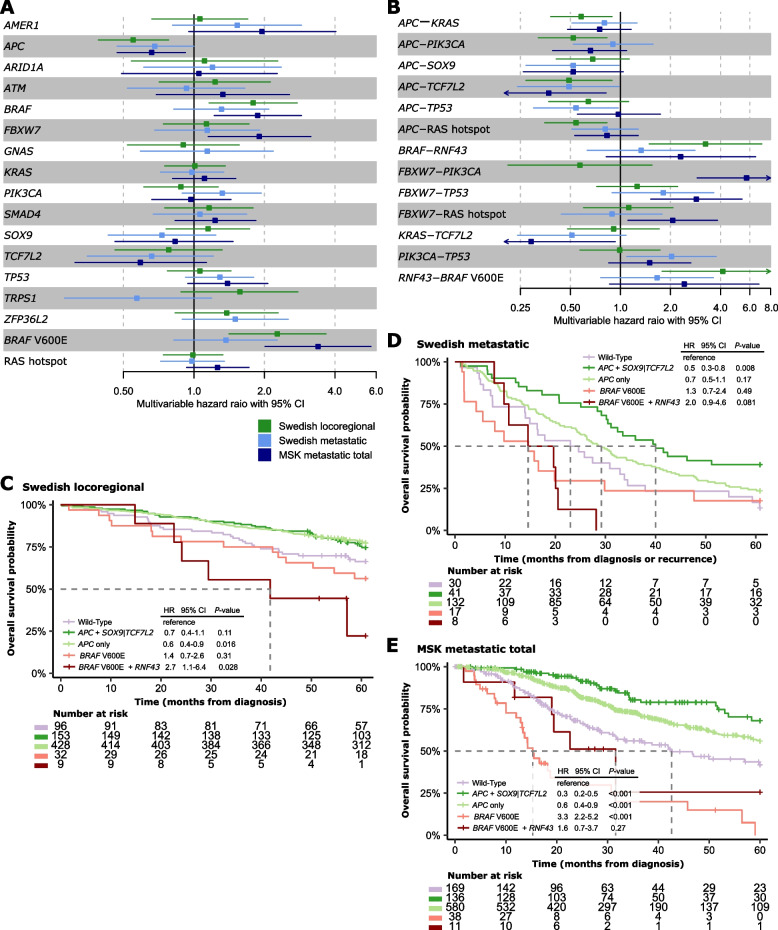
Fig. 2.
Survival analyses of single mutations and co-occurring mutations in each cohort. A-B Forest plots for multivariable Cox proportional hazards models of overall survival according to each of the most frequent (A) single mutations and (B) co-mutations in each cohort. The reference group is cancers without mutations in the respective genes. Only co-mutations with significant prognostic associations (p < 0.05) in at least one cohort are shown. C-E Kaplan–Meier plots of overall survival according to selected co-mutations in each cohort. The wild-type group represents patients without mutations in any of the genes considered, and was used as reference group in statistical comparisons. Hazard ratios are from Cox proportional hazard analyses, and p-values from Wald’s tests. One patient in the Swedish locoregional cohort had missing survival information

