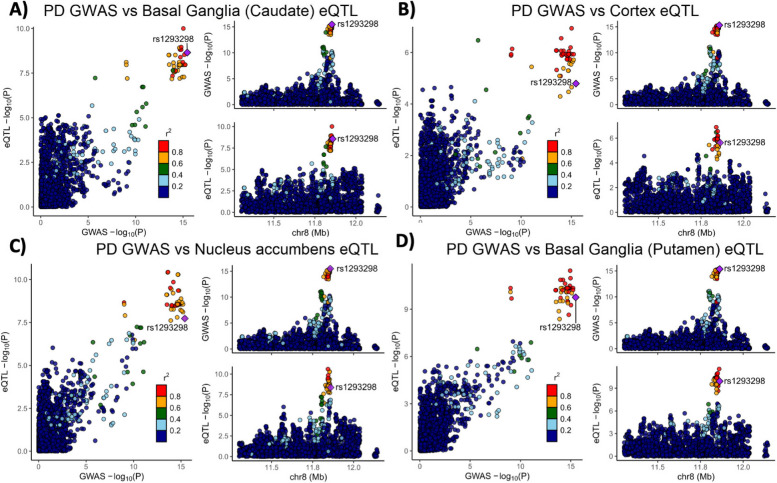
Fig. 1.
Genetic dissection of the CTSB locus in Parkinson’s disease risk. Locus zoom plots depicting the CTSB locus (± 500 kb) in Parkinson's disease GWAS with brain eQTLs. The top PD-associated variant (rs1293298) is highlighted in purple, and variants in strong LD (r2 > 0.8) are in red. Each panel includes three plots: The left plot in each panel compares the p values from the PD GWAS and expression data for each variant. Variants that are in the top right corner of this plot are therefore associated with both risk of PD and CTSB expression. The top right plots depict the PD GWAS association in this locus and is identical in all four panels. On the bottom right of each panel, the plot depicts the association between variants in this locus and CTSB RNA expression in the relevant tissue. A PD GWAS plotted together with Basal ganglia (Caudate) eQTL. B PD GWAS plotted together with Cortex eQTL. C PD GWAS plotted together with Nucleus accumbens eQTL. D PD GWAS plotted together with Basal ganglia (Putamen) eQTL

