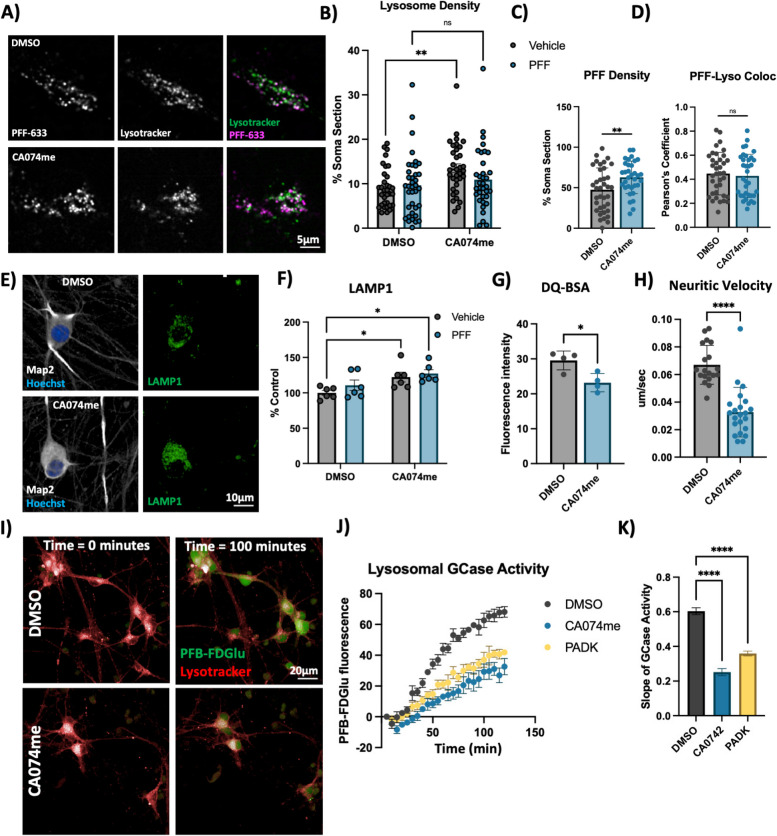
Fig. 3.
Cathepsin B inhibition increases lysosome abundance but impairs function in dopaminergic neurons. A Representative live-cell confocal images of neuronal cell bodies stained with lysotracker-green 72-h after exposure to alexa-633 labelled α-syn PFFs (80 nM). B Lysosome density per cell body, measured as the percentage of lysotracker-positive area per cell soma. C PFF density per cell body, measured as the percentage of PFF-633-positive area per cell soma. D Colocalization of lysotracker and PFF-633 measured using Pearson’s coefficient per cell soma. E Representative immunofluorescent images from high-content confocal imaging of DA neurons treated with CA074me (1 μM) and/or α-syn PFFs (300 nM) for 3 weeks and stained for Map2 and LAMP1. F Quantification of LAMP1 in Map2-positive cells. G Lysosomal degradative capacity measured by fluorescence intensity of DQ-BSA fluorogenic probe 24-h after dye loading. H Quantification of lysosome velocity in neurites measured by live-cell confocal imaging and quantified using TrackMate. Points represent individual quantified image fields derived from 6 independent experiments. I Representative images of neurons stained with lysotracker deep-red and PFB-FDGlu fluorescent signal at baseline and 100 min after dye-loading. J Quantification of PFB-FDGlu fluorescence per cell in DA neurons pre-treated for 24-h with CA074me or PADK. K Quantification of the slope of PFB-FDGlu fluorescence versus time. T-test or Bonferroni-corrected t-tests, * p < 0.05, ** p < 0.01, **** p < 0.0001

