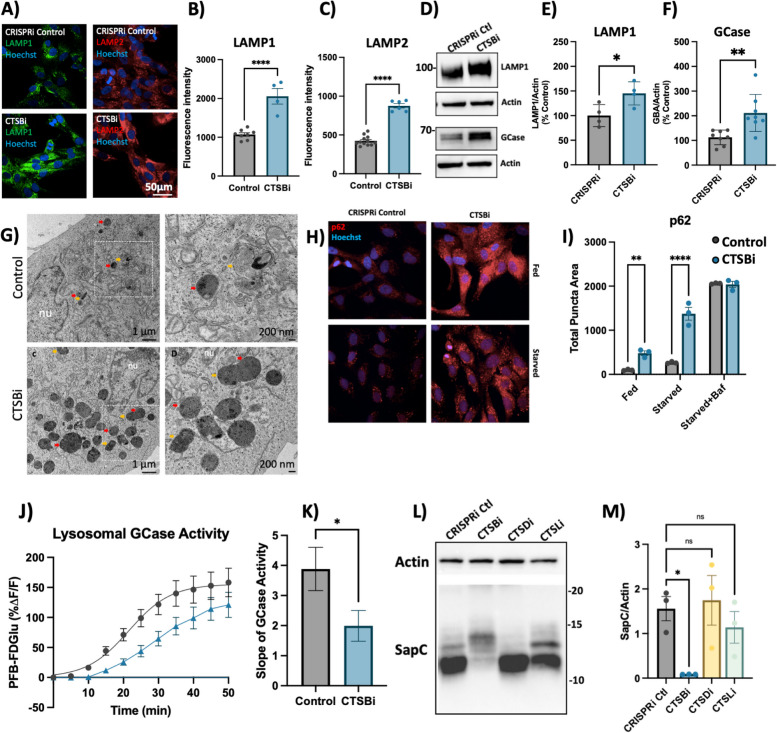
Fig. 5.
CTSB repression increases lysosome abundance but impairs function in RPE1 cells. A-C Representative images and quantifications of LAMP1 and LAMP2 immunofluorescence in CRISPRi control and CTSBi RPE1 cells. D-F Representative western blots and quantifications depicting protein levels of LAMP1 and GCase/GBA relative to actin. G Electron microscopy images of CRISPRi and CTSBi RPE1 cells. Electron-dense multivesicular bodies-like structures are indicated by red asterisk, lysosomes by orange asterisk, secondary lysosomes by green asterisk, whereas mitochondria are indicated by blue asterisk. H, I Representative immunofluorescent images and quantification of p62 area per cell in RPE1 cell lines (CRISPRi control – grey bars, and CTSBi – blue bars) under fed, 16-h starvation and 16-h starvation with bafilomycin conditions. J GCase activity measured as PFB-FDGlu fluorescence intensity over time. K Quantification of the slope of the PFB-FDGlu fluorescence versus time curves. L, M Representative saposin C (sapC) western blot and quantification relative to actin loading control. Bonferroni-corrected t-tests, * p < 0.05, *** p < 0.001. T-test or Bonferroni-corrected t-tests, * p < 0.05, ** p < 0.01, **** p < 0.0001

