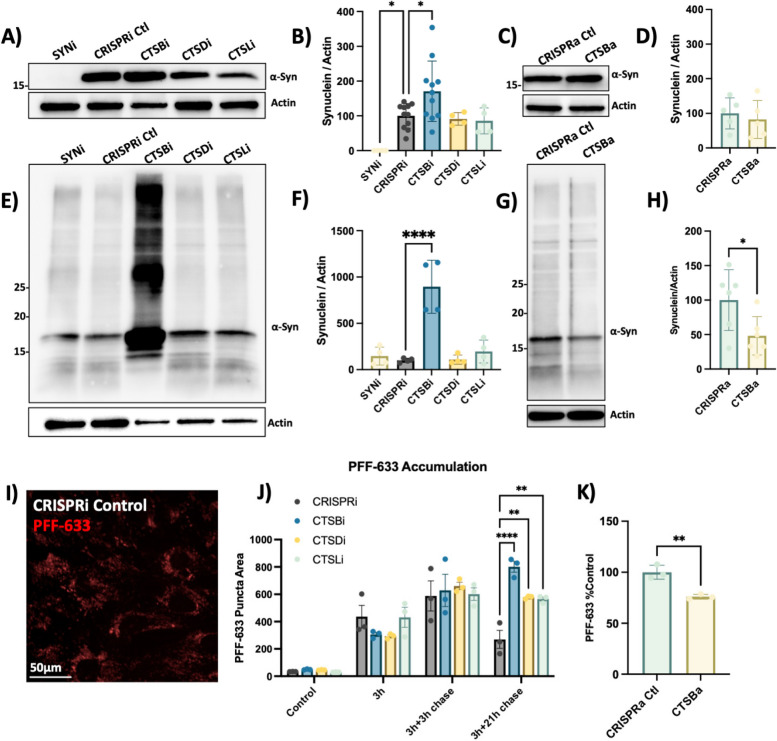
Fig. 6.
CTSB but not CTSD or CTSL repression impairs PFF clearance in RPE1 cells. A Representative western blot depicting protein levels of α-syn and actin. B Western blot quantification depicting protein levels of α-syn relative to actin expressed as percentage of CRISPRi control. C Representative western blot depicting protein levels of α-syn and actin. D Western blot quantification depicting protein levels of α-syn relative to actin expressed as percentage of CRISPRa control. E Representative western blot depicting protein levels of α-syn and actin 48-h after treatment of RPE1 cell lines with 300 nM of α-syn PFFs. F Western blot quantifications depicting levels of α-syn (quantification of whole lane) relative to actin in PFF treated RPE1 cells. G Representative western blot depicting protein levels of α-syn and actin 48-h after treatment of RPE1 cell lines with 300 nM of α-syn PFFs. H Western blot quantifications depicting levels of α-syn (quantification of whole lane) relative to actin in PFF treated RPE1 cells. I Representative image of CRISPRi control RPE1 cells 48-h after treatment with alexa-633 tagged α-syn PFFs (80 nM). J, K Quantification of PFF-633 fluorescent intensity per cell in RPE1 cell lines. T-test or Bonferroni-corrected t-tests, * p < 0.05, ** p < 0.01, *** p < 0.001, **** p < 0.0001

