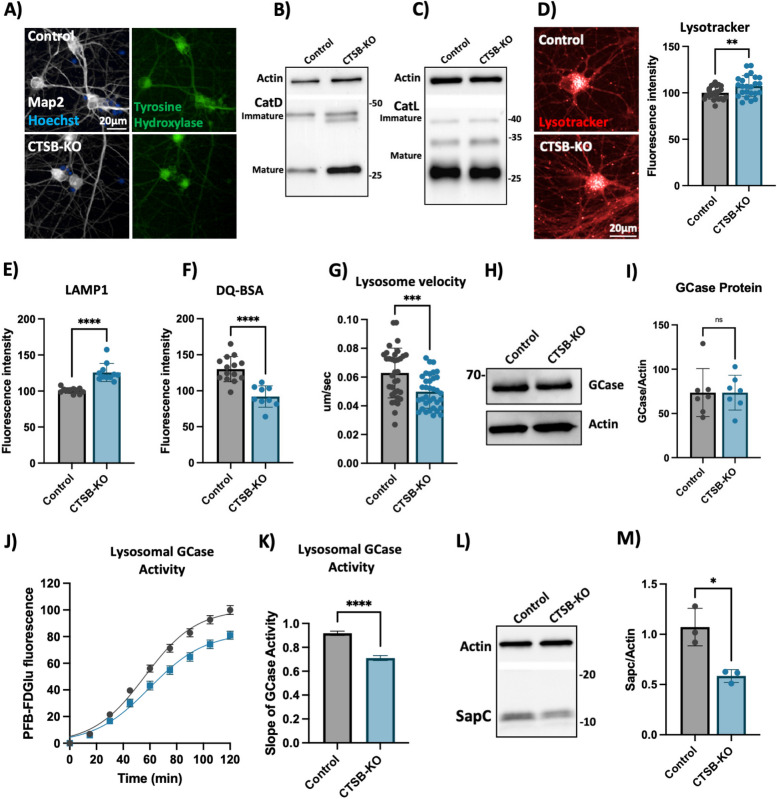
Fig. 7.
CTSB knockout impairs lysosome function in dopaminergic neurons. A Representative immunofluorescent images from high-content confocal imaging of iPSC-derived DA neurons differentiated from control or CTSB-KO iPSCs and stained for Map2, tyrosine hydroxylase (TH) and α-syn. B Representative western blot depicting CatD protein levels in control and CTSB-KO neurons. C Representative western blot depicting CatL protein levels in control and CTSB-KO neurons. D High-content imaging representative image and quantification of lysotracker fluorescence in DA neurons. E LAMP1 immunofluorescence per cell in Map2-positive DA neurons. F Lysosomal degradative capacity measured by fluorescence intensity of DQ-BSA fluorogenic probe 24-h after dye loading. G Quantification of lysosome velocity in neurites measured by live-cell confocal imaging and quantified using TrackMate. Points represent individual quantified image fields derived from 6 independent experiments. H, I Representative western blot and quantification of GCase and actin in DA neurons. J Quantification of PFB-FDGlu fluorescence per cell in DA neurons K) Quantification of the slope of PFB-FDGlu fluorescence versus time. L, M Representative saposin C (sapC) western blot and quantification relative to actin loading control. T-tests, ** p < 0.01, *** p < 0.001, **** p < 0.0001

