Fig. 8.
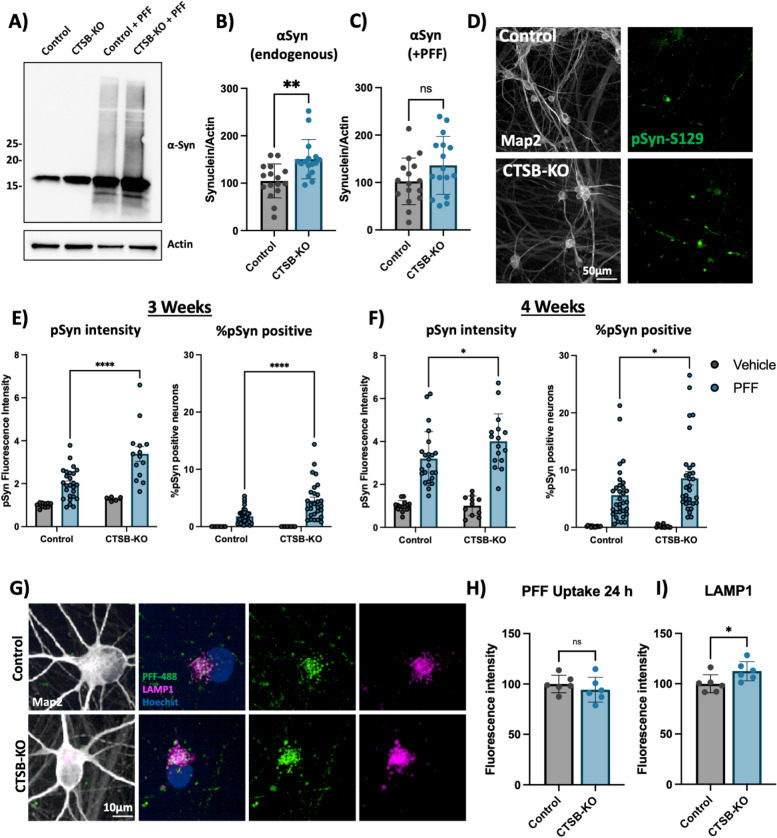
CTSB knockout enhances the effect of α-syn PFFs on dopaminergic neurons. A Representative western blot showing levels of α-syn in untreated control or CTSB-KO DA neurons as well as PFF treated DA neurons. B, C Western blot quantifications depicting protein levels of α-syn relative to actin for endogenous α-syn (B) or PFF (C), normalized to the respective control. D Representative immunofluorescent images from high-content confocal imaging of Control or CTSB-KO DA neurons treated with α-syn PFFs (300 nM) and stained for Map2 and pSyn-S129. E, F) Quantification of pSyn-S129 in Map2-positive cells 3-weeks (E) and 4-weeks (F) after PFF treatment. Left graphs depict pSyn-S129 fluorescence intensity within Map2-positive cells, and right graphs depict the percentage of Map2-positive cell bodies positive for pSyn-S129 aggregates. G Representative immunofluorescent images from high-content confocal imaging of DA neurons treated with alexa-488 tagged PFFs (PFF-488, 80 nM) for 24 h and stained for LAMP1 and Map2. H Quantification of PFF-488 fluorescence per Map2-positive cell. I Quantification of LAMP1 fluorescence per Map2-positive cell. T-tests or Bonferroni-corrected t-tests, ** p < 0.01, **** p < 0.0001

