Fig. 6.
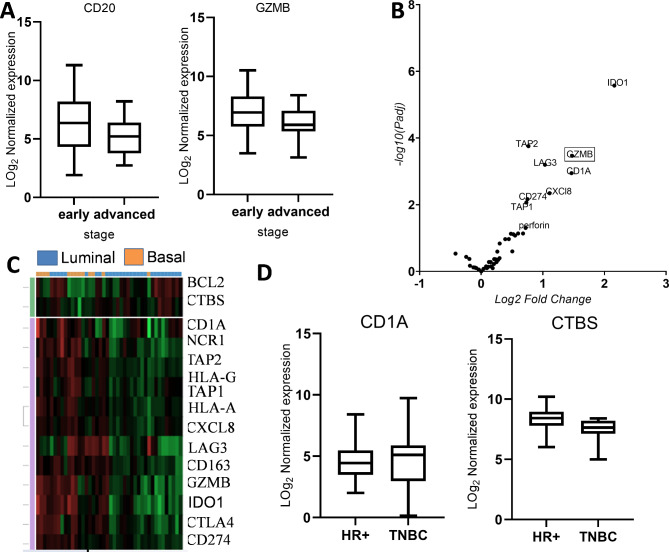
Differentially expressed immune genes in BC subtypes. A: Box and whisker plot showing a differential expression of CD20 and GZMB between early and advanced pathologic stages. B: Volcano plot of DEGs between luminal and non-luminal tumours. Volcano plot is plotted using Graph Pad Prism to show differentially expressed immune genes; FC > 1.5, adjusted P values < 0.05. Each dot represents an immune gene. C: DEG heat map of luminal versus basal like tumours, green shows downregulation and red shows upregulation. D: Box and whisker plot showing a differential expression of CD1A and CTBS between HR + and TNBC. DEG: Differentially expressed genes

