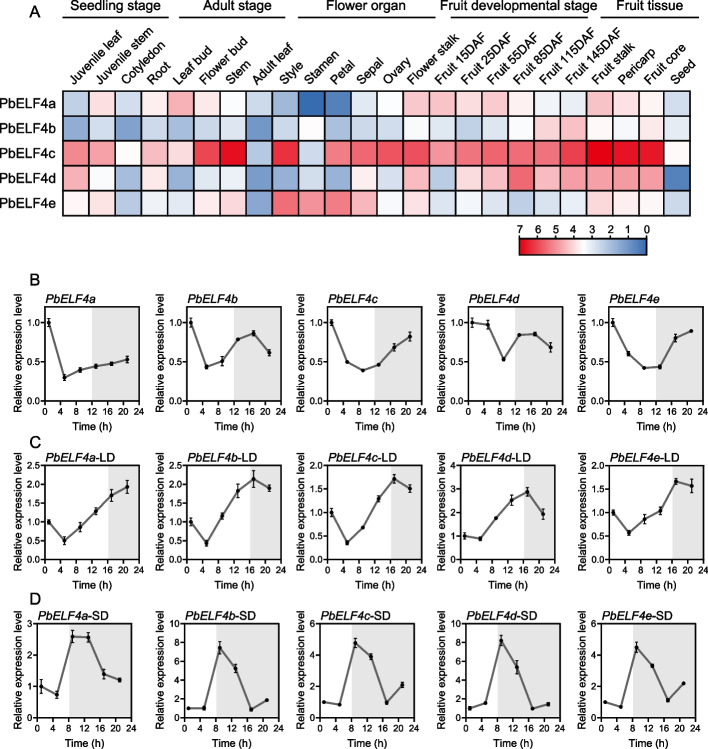
Fig. 3.
Expression analysis of PbELF4 genes. (A) Expression profiles of PbELF4 genes in various pear tissues, including four seedling tissues (juvenile leaf, juvenile stem, cotyledon, and root), four adult tissues (leaf bud, flower bud, stem, and adult leaf), six flower organ tissues (style, stamen, petal, sepal, ovary, and flower stalk), mixed samples of pericarp and flesh at five fruit developmental stages [15 days after full bloom (DAF) to 115 DAF], and five fruit tissues at 145 DAF (flesh, fruit stalk, pericarp, fruit core, and seed). Expression levels are shown as log2 (TPM +1) values of each gene, with the color gradient indicating expression intensity. The scale bars from red to blue indicate the expression levels from high to low. B, C, D Diurnal expression patterns of PbELF4 genes in pear seedlings. B Expression patterns under 12 h light/12 h dark conditions. C Expression patterns under long-day conditions (LD, 16 h light/8 h dark). D Expression patterns under short-day conditions (SD, 8 h light/16 h dark). The light was turned on for 1 hour to start sampling, each with an interval of 4 hours. White and grey areas indicate light and darkness, respectively. The expression of each gene in sample 1 was set to “1.” PbUBQ was used as an internal control. Data are presented as means ± standard deviation (SD) (n = 3)

