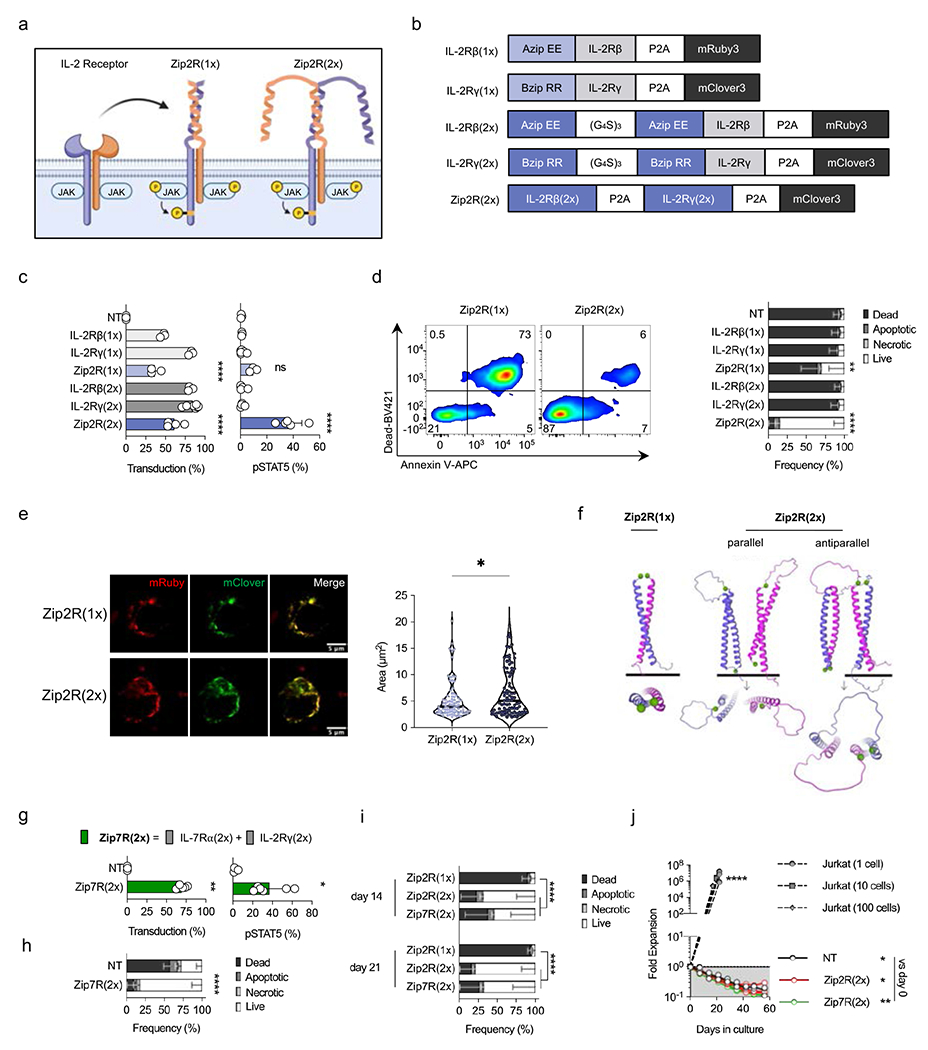
Figure 1: Two leucine zipper motifs endow ZipRs with constitutive signal transduction.

(a) Schematic of IL-2 receptor-based leucine zipper receptors (Zip2R). (b) Zip2R(1x) and Zip2R(2x) constructs. (c) Transduction efficiency of human T cells as measured by mRuby [IL-2Rβ(1x), IL-2Rβ(2x)], mClover [IL-2Rγ(1x), IL-2Rγ(2x), Zip2R(2x)], or mRuby and mClover [Zip2R(1x)] expression (left). Phosphorylated STAT5 expression in transduced human T cells (right) (N=3-6 biological replicates, mean±SD, ****p<0.0001, one-way ANOVA with Tukey’s multiple comparisons test). (d) Viability of transduced T cells after 7-day cytokine starvation as determined by flow cytometry (Dead : Viability dye+ Annexin V+; Apoptotic : Viability dye− Annexin V+; Necrotic : Viability dye+ Annexin V−; Live: Viability dye− Annexin V−) (N=3 biological replicates, mean±SD, **p<0.01, ****p<0.0001, two-way ANOVA with Tukey’s multiple comparisons test for live T cells). (e) Representative confocal microscopy images of transfected HEK293T cells (left). Colocalization area of mRuby and mClover (right) (N=80(L), N=89(R), *p<0.05, Kolmogorov-Smirnov test). (f) AlphaFold structure prediction of Zip2R(1x) and Zip2R(2x) as seen from the front and rotated 90 degrees. The starting residue, methionine, is shown as a green sphere. (g) Transduction efficiency of human T cells as measured by mClover expression (left). Phosphorylated STAT5 expression in transduced human T cells (right) (N=3-6 biological replicates, mean±SD, *p<0.05, t-test). (h) Viability of transduced T cells after 7-day cytokine starvation as determined by flow cytometry (Viability dye/Annexin V) (N=3 biological replicates, mean±SD, ****p<0.0001, two-way ANOVA with Bonferroni’s multiple comparisons test for live T cells). (i) Viability of transduced T cells after 14- or 21-day cytokine starvation as determined by flow cytometry (Viability dye/Annexin V) (N=3 biological replicates, mean±SD, ****p<0.0001, two-way ANOVA with Tukey’s multiple comparisons test for live T cells). (j) Autonomous cell outgrowth assay: 1, 10, or 100 Jurkat cells or 1.5×10⁷ Zip2R(2x) or Zip7R(2x) transduced T cells were seeded in a G-REX cell culture plate and quantified weekly (N=3, *p<0.05, **p<0.01, two-way ANOVA of log transformed data with Dunnett’s multiple comparisons test). NT = non-transduced.
