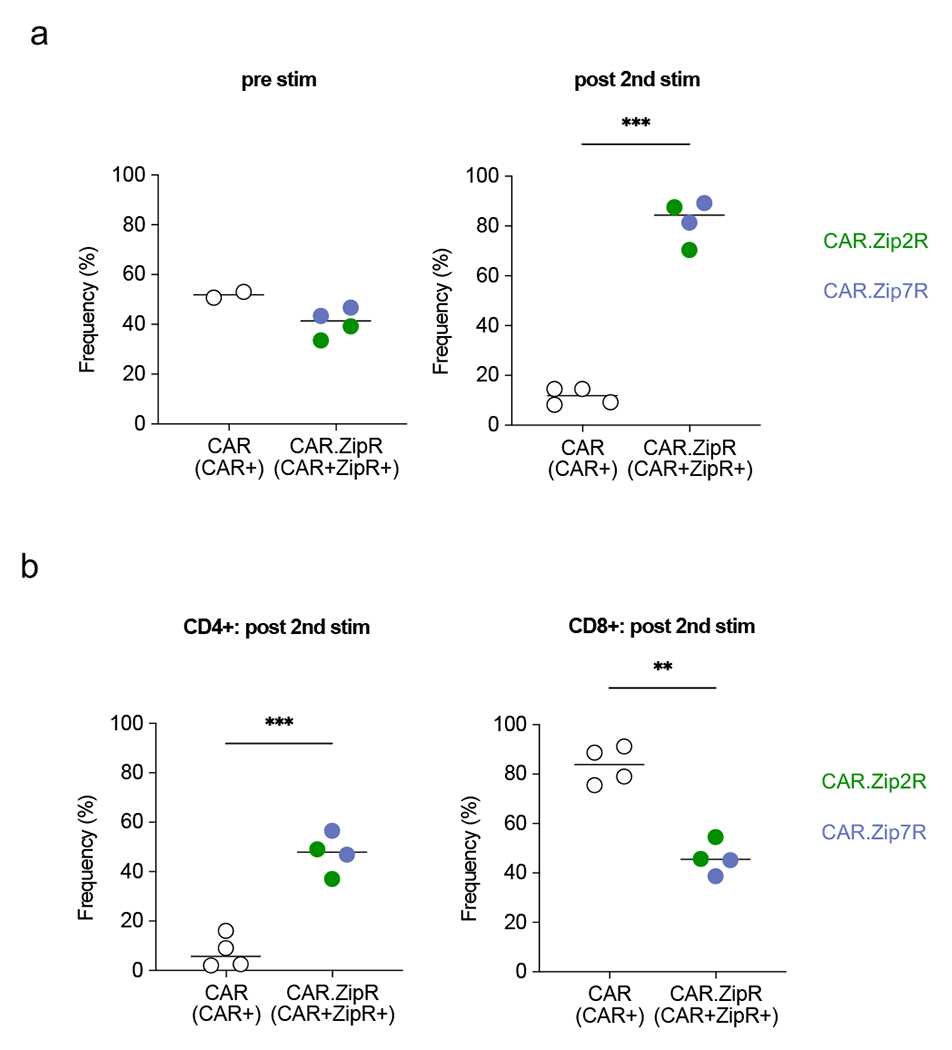
Extended Data Figure 5: Phenotypic analysis of B7-H3-CAR T cells following stimulation with A549 WT.

B7-H3-CAR+, CAR+Zip2R+, or CAR+Zip7R+ T cells were stimulated twice with A549 WT. CAR positive or CAR and ZipR positive T cells were quantified by flow cytometry pre and post 2nd stimulation (stim) and CD4 and CD8 positive T cells post 2nd stim (N=2 donors).
(a) Percent CAR+ or CAR+ZipR+ cells pre and post 2nd stim (ns: nonsignificant, ***p<0.001, paired t-test). (b) Percent CD4+ (left panel) or CD8+ (right panel) cells post 2nd stimulation (**p<0.01, ***p<0.001, paired t-test).
