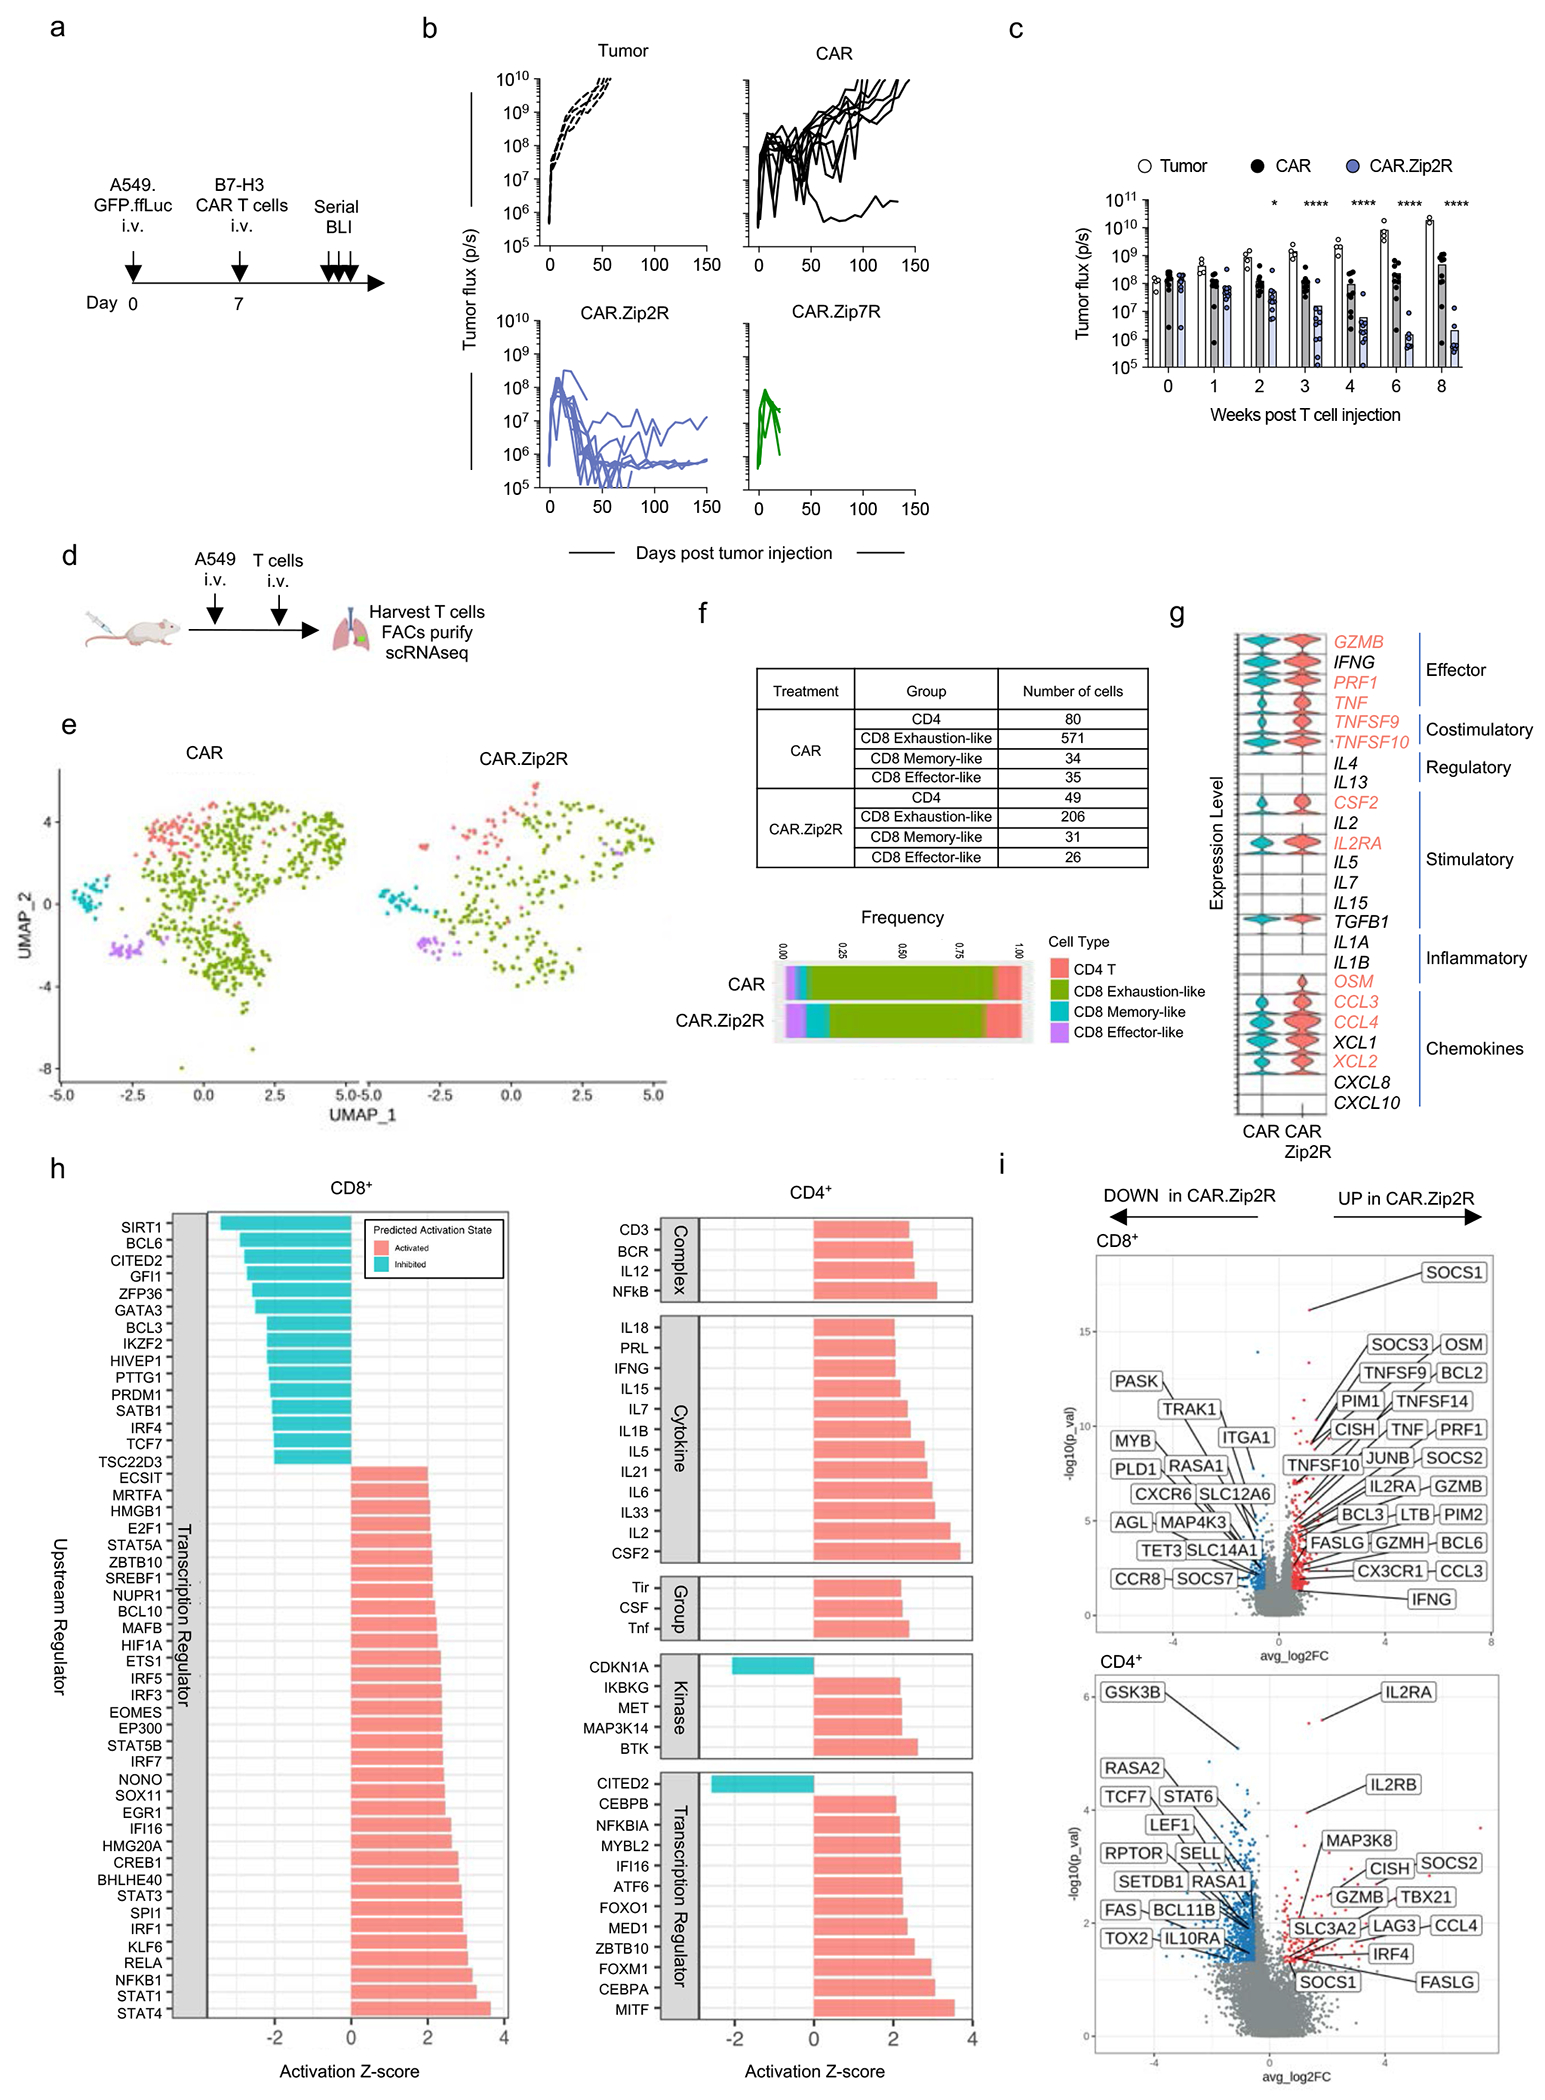
Figure 4: ZipRs augment CAR T cell antitumor activity in vivo.

(a) Experimental scheme of i.v. A549.GFP.ffLuc model; mice received a single i.v. dose of 3×10⁵ CAR T cells on day 7 post tumor cell injection. (b) Tumor burden in the lungs as determined by serial bioluminescence imaging (N=5 [tumor and CAR.Zip7R] N=10 [CAR and CAR.Zip2R] from two donors). (c) Quantification of tumor flux in the lungs of treated mice (mean±SD, *p<0.05, ****p<0.0001, two-way ANOVA of log transformed BLI data). (d) scRNAseq experimental scheme. (e) UMAP projection of CAR or CAR.Zip2R T cells. (f) Quantification of cell population frequencies. (g) Expression of cytokines, chemokines, and surface effector markers. Red text indicates factors that are expressed log2FC > 0.5 with an adjusted p value < 0.05 for CD4+ and CD8+ CAR.Zip2R compared to CAR T cells (Wilcoxon rank sum test with Bonferroni correction). (h) Ingenuity Pathway Analysis for CD8 and CD4 CAR.Zip2R T cells. (i) DEGs with log2FC > 0.5 or < −0.5 and adjusted p value < 0.05 in CD8+ and CD4+ T cells.
