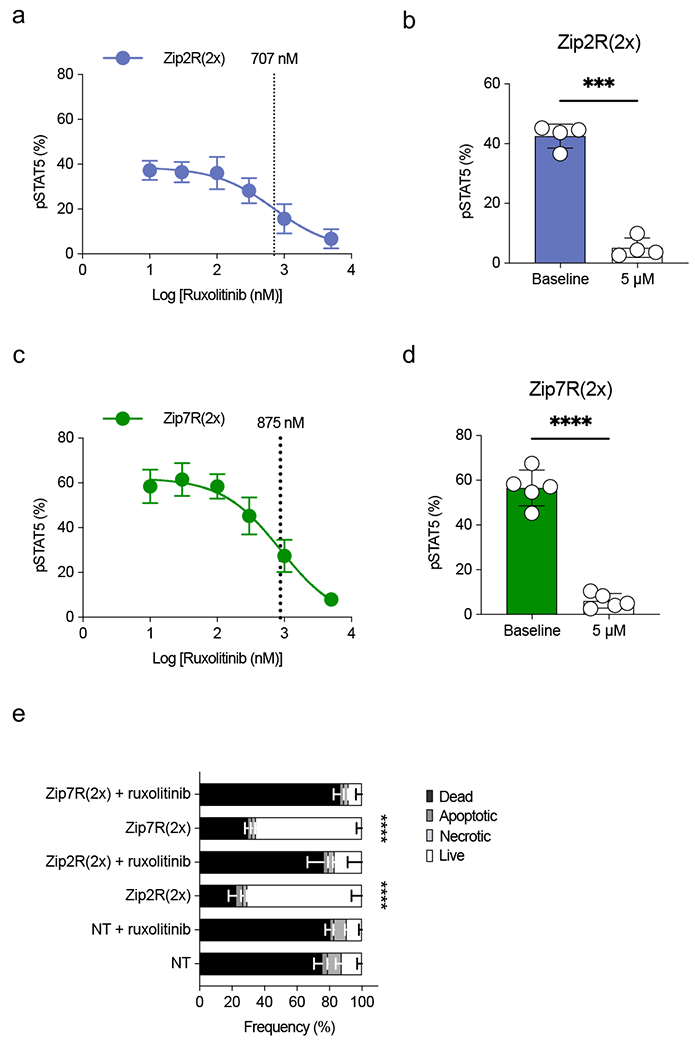
Extended Data Figure 3: ZipR signaling is inhibited by ruxolitinib.

(a) pSTAT5 expression in Zip2R(2x) transduced T cells treated with increasing concentrations of ruxolitinib. IC50 is indicated with a dashed line (N=3, mean±SD). (b) pSTAT5 expression in Zip2R(2x) transduced T cells at baseline or following 24-hour incubation with 5 μM ruxolitinib (mean±SD, ***p<0.001, paired t-test). (c) pSTAT5 expression in Zip7R(2x) transduced T cells treated with increasing concentrations of ruxolitinib. IC50 is indicated with a dashed line (N=3, mean±SD). (d) pSTAT5 expression in Zip7R(2x) transduced T cells at baseline or following 24-hour incubation with 5 μM ruxolitinib (mean±SD, ***p<0.001, paired t-test). (e) Viability of untreated or 5 μM ruxolitinib-treated T cells after 7 days of cytokine starvation (Dead : Viability dye+ Annexin V+; Apoptotic : Viability dye− Annexin V+; Necrotic : Viability dye+ Annexin V−; Live: Viability dye− Annexin V−) (N=3, mean±SD, ****p<0.0001, two-way ANOVA with Bonferroni’s multiple comparisons test for live T cells).
