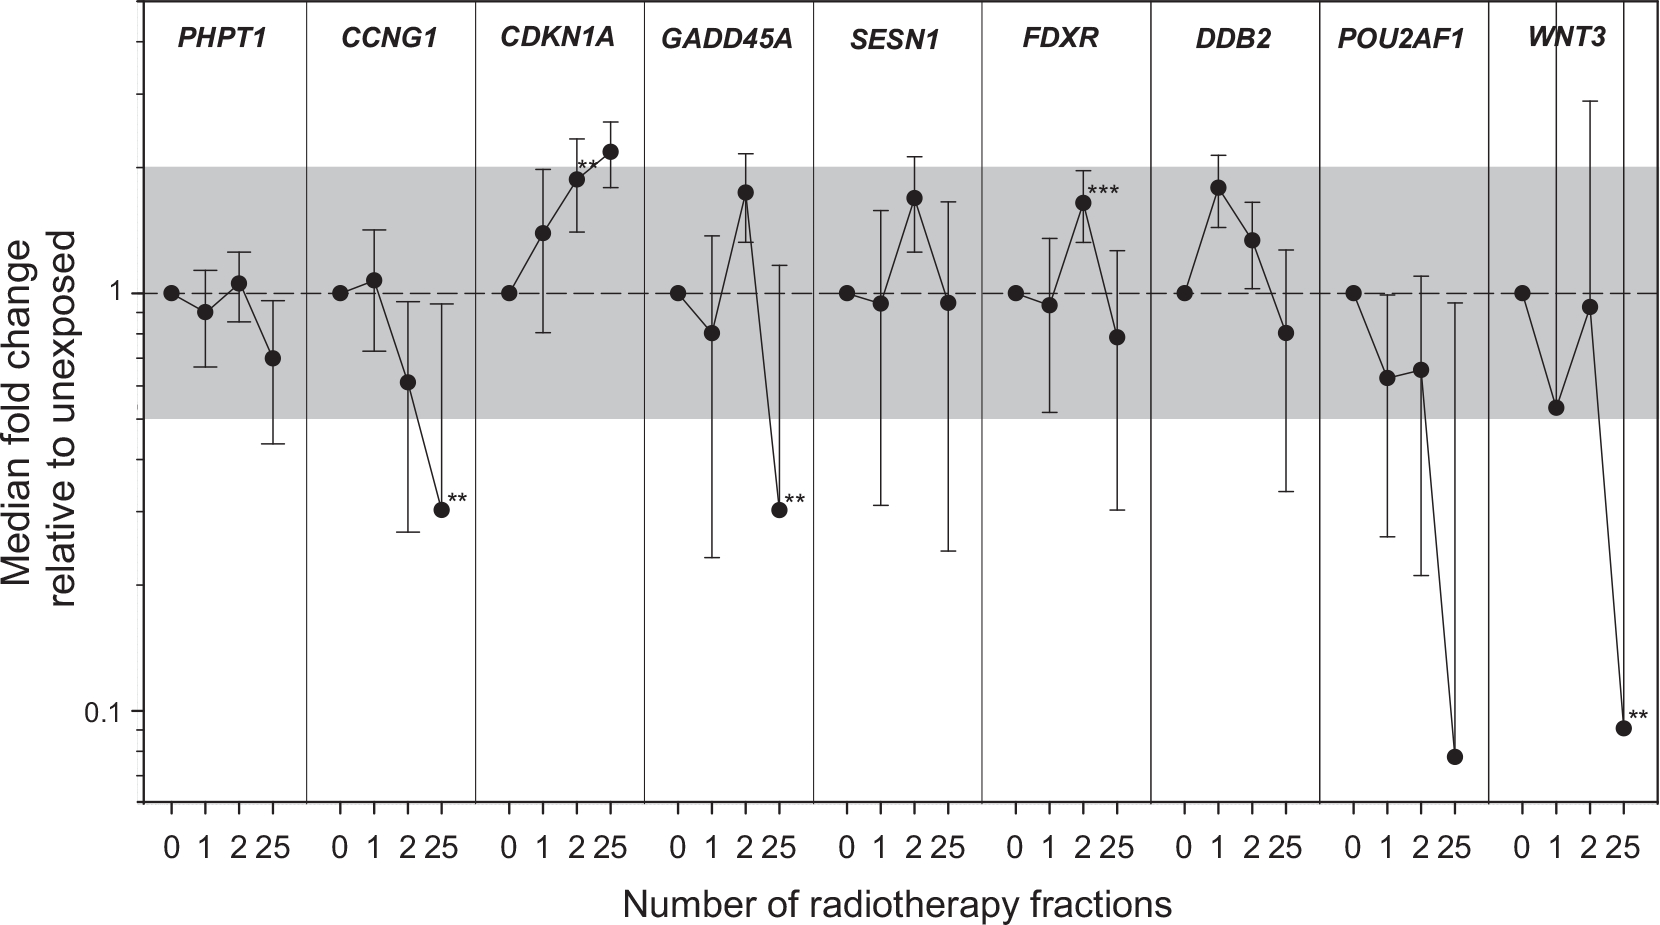
FIG. 2.

Aggregated data of DGE in saliva for all 9 genes (PHPT1, CCNG1, CDKN1A, GADD45, SESN1, FDXR, DDB2, POU2AF1, and WNT3) is shown over time of the radiotherapy scheme (number of radiotherapy fractions). GE is given as fold change (FC) relative to unexposed (normalized against a combination of ACTB/ATP6/B2M). Symbols reflect the median (N = 7), and error bars the standard error of the mean (SEM). The superimposed grey area refers to a FC < |2|. Significant changes in GE relative to unexposed are indicated with asterisks (**P < 0.02). Individual plots per donor and gene are shown in Supplementary Fig. S1 (https://doi.org/10.1667/RADE-26-00176.1.S1).
