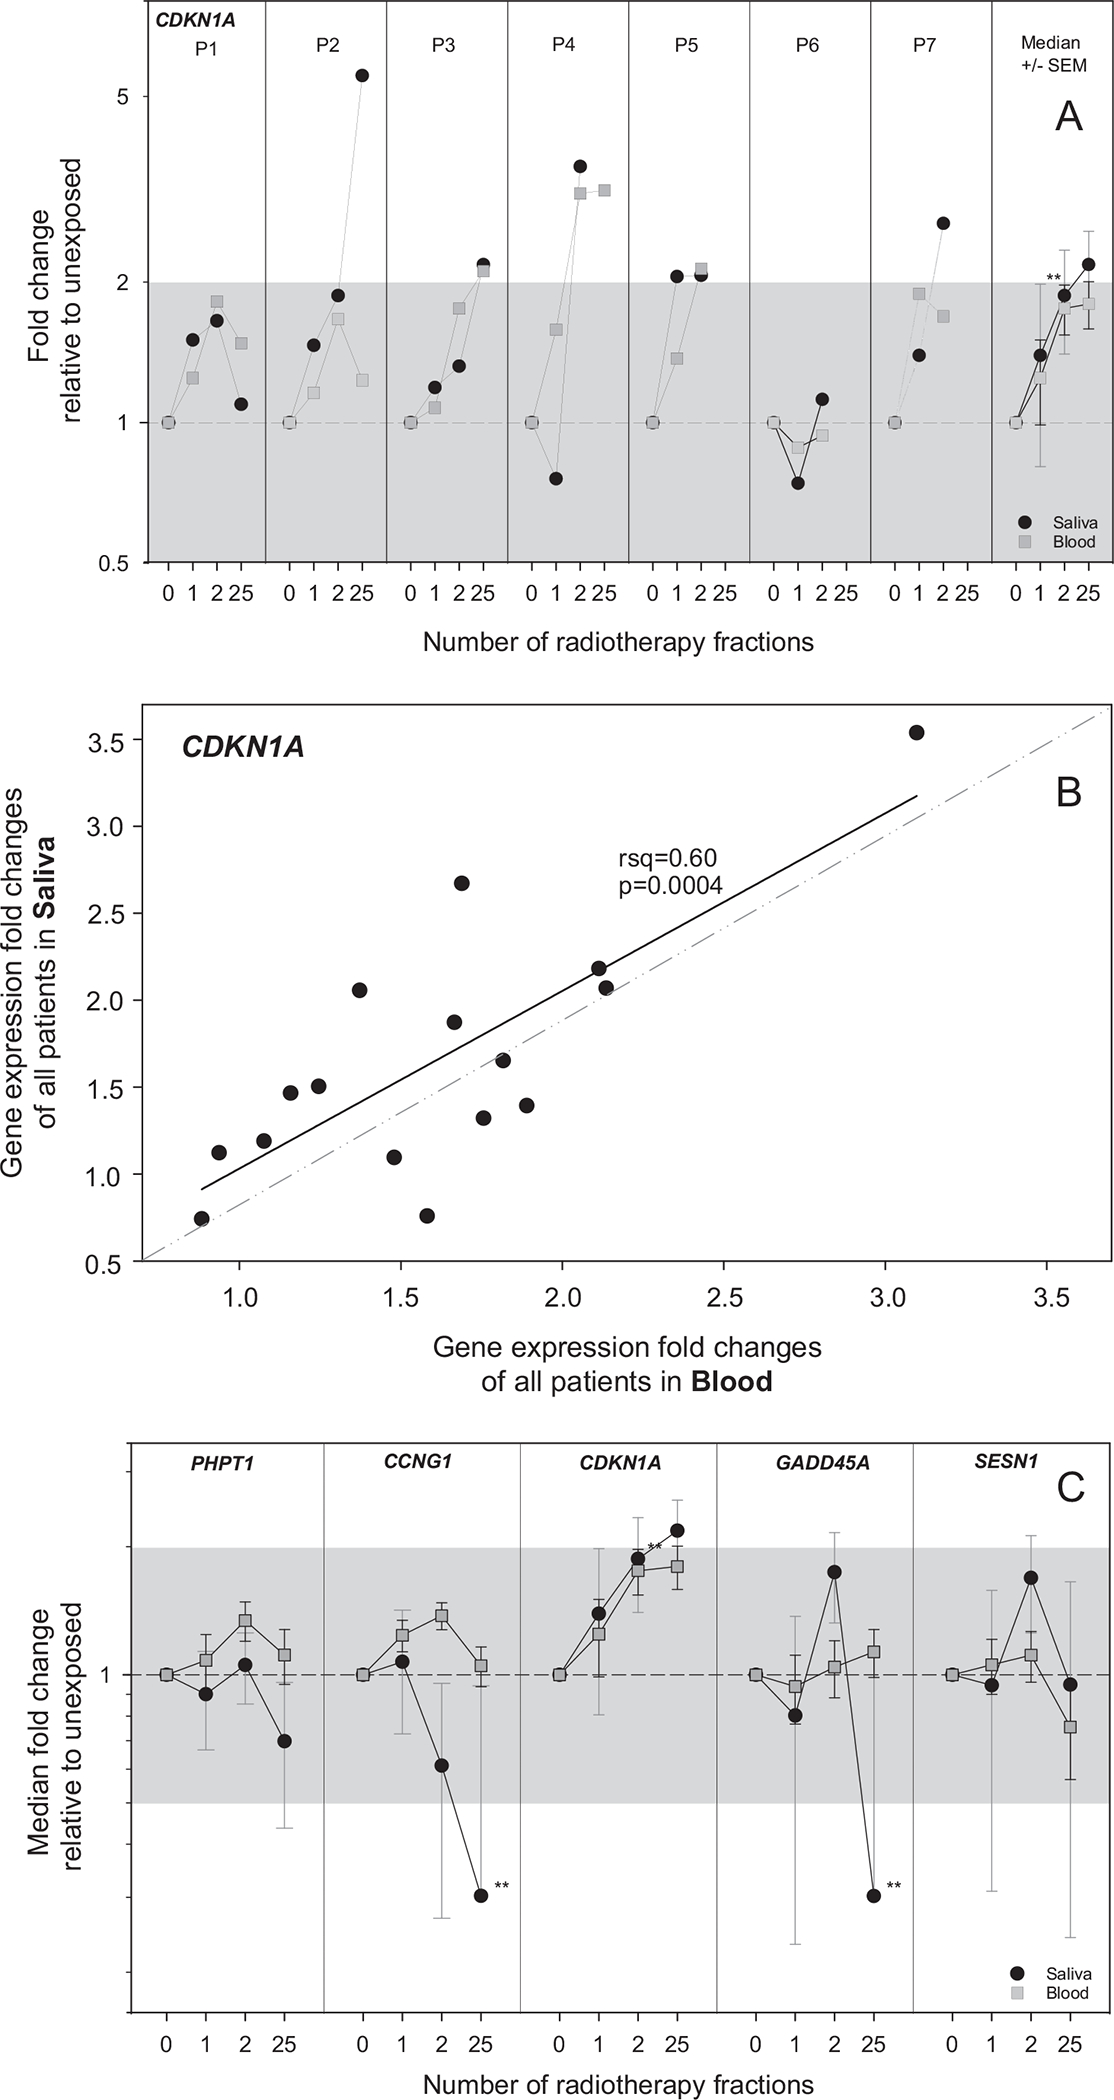
FIG. 3.

This figure focuses on the comparison of radiation-induced DGE of CDKN1A, PHPT1, CCNG1, GADD45, and SESN1 in saliva versus blood (task III-1). Panel A: the DGE of CDKN1A is shown by way of example for each patient in separate panels over time of the radiotherapy scheme (number of radiotherapy fractions). GE is given as fold change (FC) relative to unexposed (normalized against a combination of ACTB/ATP6/B2M in saliva samples and HPRT1 in blood samples). The black circles represent GE results from saliva samples, and gray squares represent GE results from blood samples. In the right panel, data of all patients for CDKN1A is aggregated. Symbols reflect the median (N = 7), and error bars the standard error of the mean (SEM). The superimposed gray areas refer to a FC < |2|. Significant changes in GE relative to unexposed are indicated with asterisks (**P < 0.02). Panel B: FC values obtained with RNA from saliva samples and those obtained with RNA from blood samples for each measurement were correlated with linear regression analysis (calculated R2 and P values are provided). Outliers from 95% confidence interval were excluded. Panel C: Equivalently shows aggregated data for PHPT1, CCNG1, CDKN1A, GADD45, and SESN1. Individual plots per donor and gene are shown in Supplementary Fig. S1 (https://doi.org/10.1667/RADE-26-00176.1.S1).
