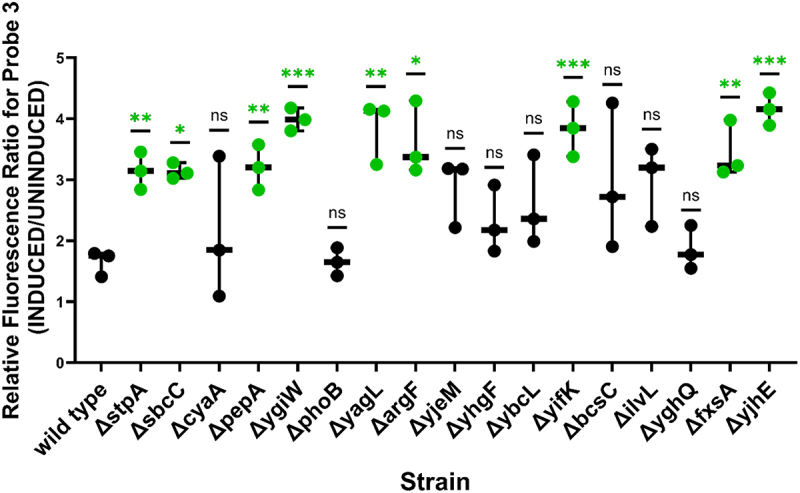
Figure 3.

Fluorescence of iRS [3-]targeting of ribozyme region P3/P4 on single-gene knockouts validated 8/16 cellular factors. Fluorescence ratios were calculated by dividing induced (probe 3 asRNA + ribozyme) by target-uninduced (probe 3 asRNA only) median fluorescence values. Individual data points shown in the graph represent the paired induced/uninduced ratio obtained for three independent biological replicates. Asterisks denote significant difference between the fluorescence ratio of probe 3 when expressed on the single-knockout strain relative to when expressed on wildtype E. coli BW25113 (unpaired t-test; *p-value < 0.05, **p-value < 0.01, ***p-value < 0.001). E. coli ΔstpA was included as a positive control for these experiments.
