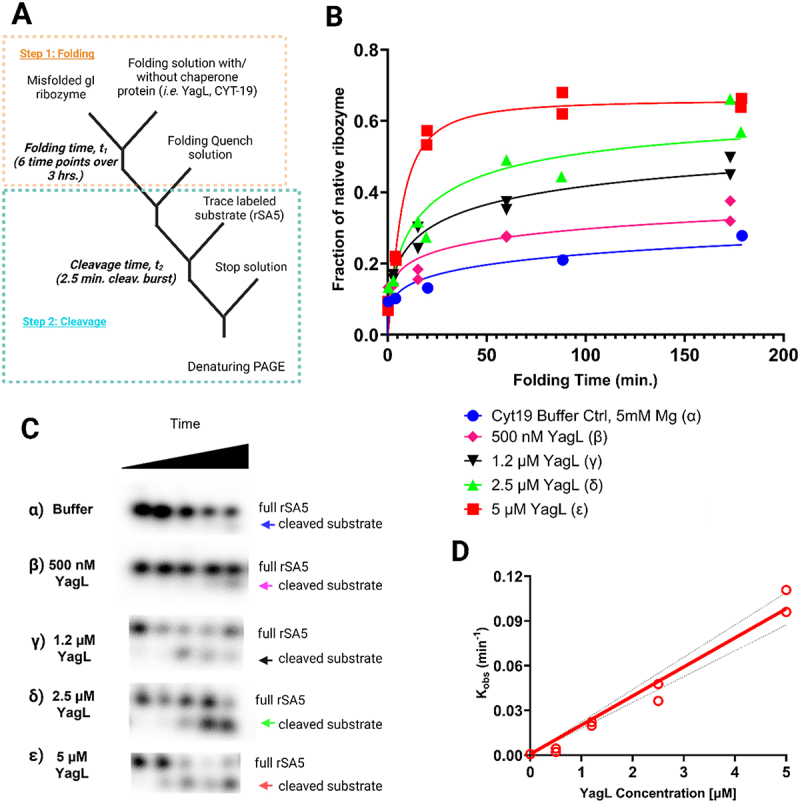
Figure 5.

Acceleration of native ribozyme folding by YagL. (A) The Tetrahymena gI intron ribozyme was pre-incubated into a misfolded state and then added into folding reactions without YagL (α), with 500 nM YagL (β), 1.2 µm YagL (γ), 2.5 µm YagL (δ), or 5 µm YagL (ε). Reactions were stopped at different times, after which radiolabeled rSA5 (which mimics the 5’-splice-site junction cleaved by the ribozyme) was added to perform substrate cleavage reactions. After quenching, reactions were stopped and analysed by denaturing PAGE to quantify product formation. (B) The fraction of cleaved substrate was quantified and used to generate plots of the fraction of native ribozyme as a function of folding time. From these plots, average rate constants from two independent determinations of native state formation were 0.0008 min−1 (α), 0.0032 min−1 (β), 0.0210 min−1 (γ), 0.0421 min−1 (δ), and 0.100 min−1 (ε). The faster reactions gave end points of 0.66, and end points for the slower reactions were forced to this value. Data points for individual determinations are provided on graph, curves represent the best fit results. (C) Gel images used to quantify cleavage product formation (these images were obtained for one out of the two independent determinations performed; raw and processed images for all replicates can be found in the supplementary information- appendix 3 for this publication). The cleaved substrate, indicated by the arrows, increases with folding time and with YagL concentration. (D) Observed rate constants from (B) plotted against YagL concentration. Dotted black lines denote the 95% confidence intervals. From this linear fitting, the second-order rate constant was determined to be in the presence of 5 mm Mg2+.
