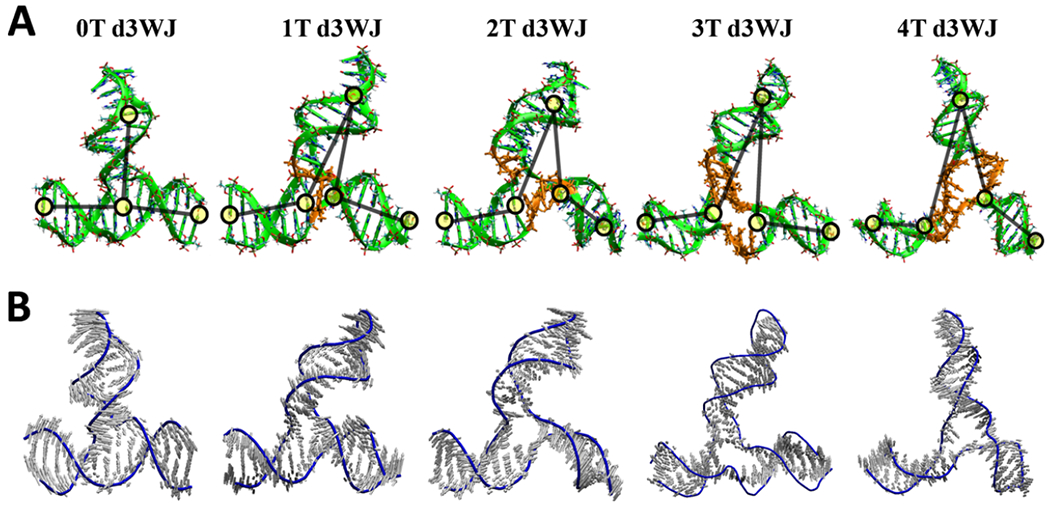
Figure 2.

(A) Average structures of each d3WJ were derived from snapshots collected during molecular dynamics (MD) simulations on the Amber force field, spanning from 20 to 120 ns. Ts in the junction region are presented in orange. Yellow circles indicate the location of bases which are used to calculate the angle between the HP loop and each lower stems. (B) The principal component analysis mode of d3WJs normalized to 2 Å.
