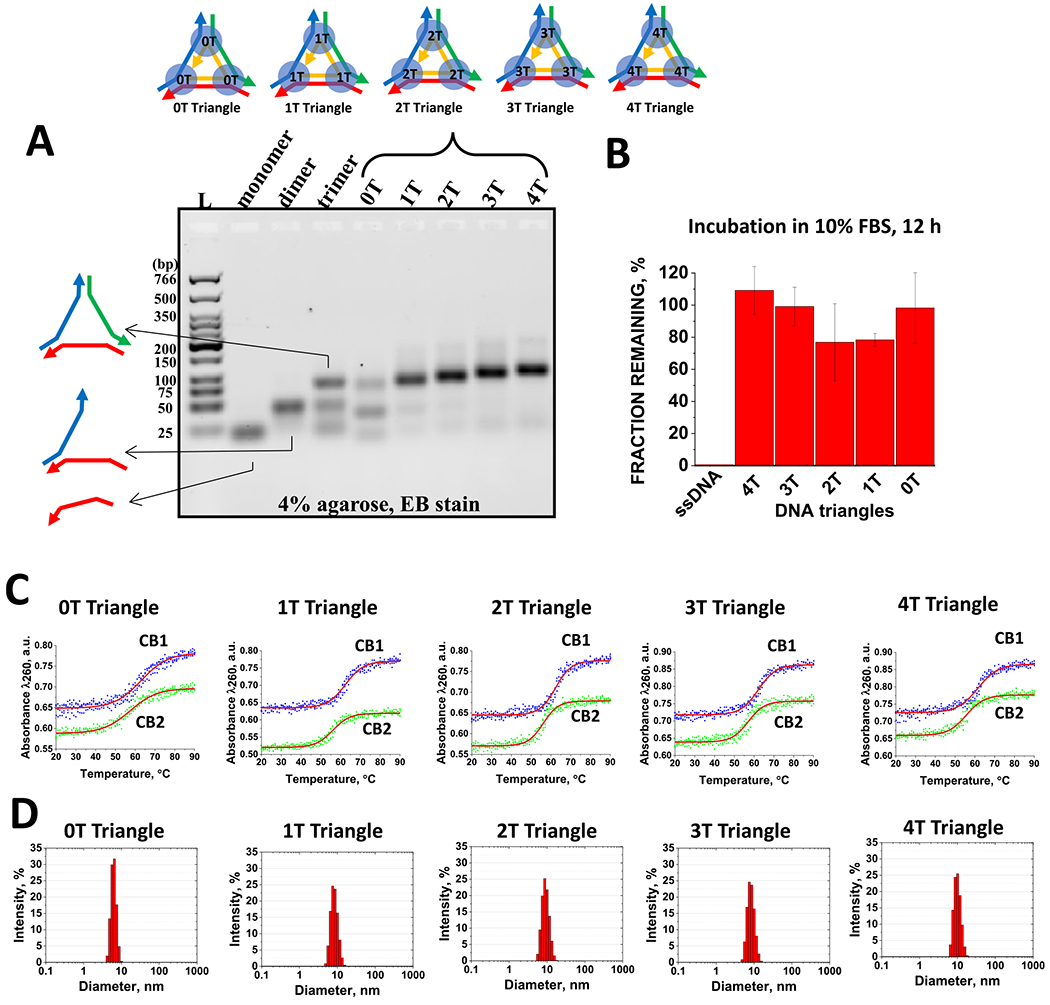
Figure 3.

(A) Self-assembly properties of the DNA triangles evaluated by agarose gel electrophoreses. (B) FBS stability assay demonstrating intact DNA triangles after 12 h of incubation in contrast to the positive control ssDNA. (C) Examples of optical melting profiles for DNA triangles in CB1 and CB2 buffers. (D) Hydrodynamic diameter profiles for the triangular complexes measured by dynamic light scattering.
