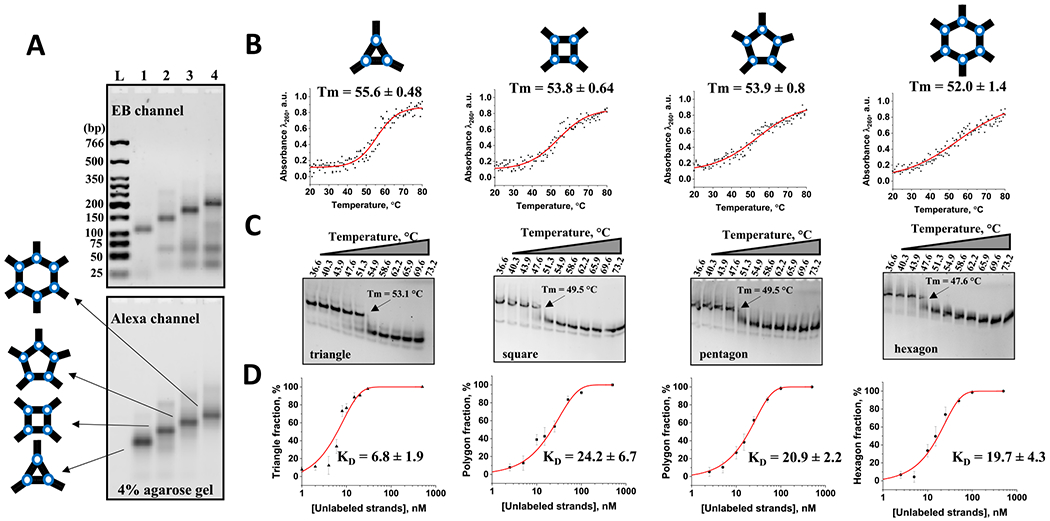
Figure 5.

(A) Alexa-488-labeled polygonal nanoparticle assembly properties assayed by 4% agarose gel electrophoreses. Gel scanned with the ethidium bromide (EB) channel to detect all DNA strands within the gel as well as Alexa channel to visualize labeled DNAs. (B) Normalized optical melt curves of 0.2 μM polygons in TMS buffer (50 mM TRIS pH = 8.0, 100 mM NaCl, and 10 mM MgCl2). (C) TGGE assay of the Alexa-488-labeled polygons showing their melting temperature points. (D) Titration curve fitting data of DNA polygon assembly showing apparent Kd values in nM (error represents standard deviation of the mean obtained from at least two independent experiments).
