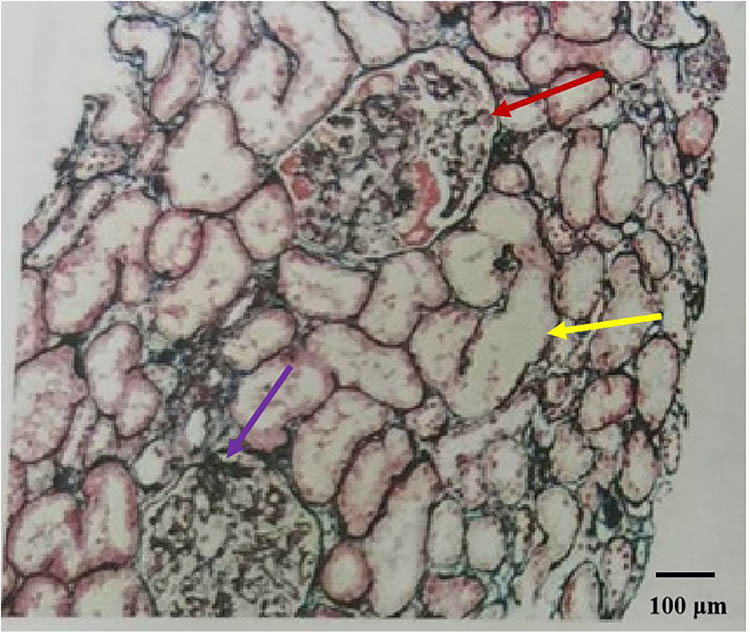
Figure 3.

(PASM + Masson ×100), Red arrows delineate areas of suspected small amounts of eosinophilic deposits in the segmental mesangial area and subendothelium, which could be indicative of immune complex deposition. Yellow arrows identify regions where the basement membrane appears denuded, suggesting loss of epithelial cells and exposure of the basement membrane. Purple arrows draw attention to the areas exhibiting features similar to FSGS, including segmental sclerosis and collapse of the capillary loops.
