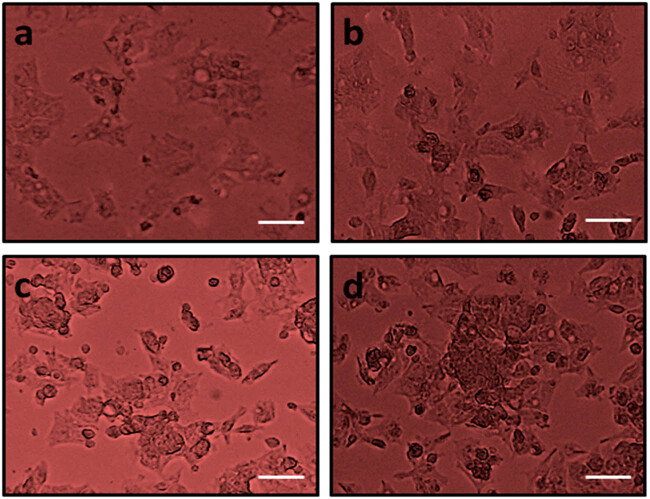
Figure 2.
Cytotoxicity effect of DN and OA at different dosages on the A549 cells. The morphology changes absorbed from control and DN and OA at different dosages treated against A549 cancer cells in phase contrast microscopy (a) control, cells treated with (b) 10 µM DN and OA, (c) 20 µM PN and OA, and (d) 30 µM DN and OA. The scale bar displayed 50 µm.

