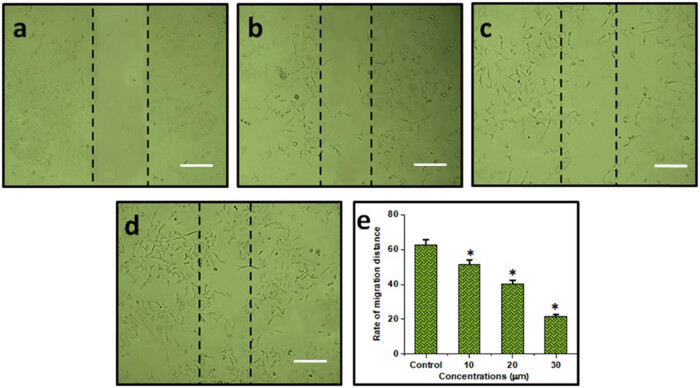
Figure 3.
Cell migration assay: (a) control; (b) cells treated with 10 µM combination of DN + OA; (c) cells treated with 20 µM combination of DN + OA; (d) cells treated with 30 µM of DN + OA. (e) A statistical examination of the frequency of cell migration. The mean value ± SD is shown, *P < 0.05. The scale bar displayed 50 µm.

