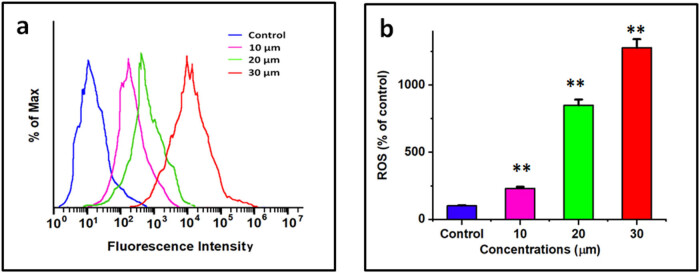
Figure 4.
The method was feasible to investigate in A549 cells the impact of both DN and OA (10, 20, and 30 µM of DN + OA) on the production of intracellular ROS through the use of 2,7-dichlorofluorescein diacetate labeling. And flow cytometry (a) using a flow cytometer, the degree of intracellular ROS buildup was quantified and dyed with DCFH-DA. (b) Quantitative evaluation of intracellular ROS levels. The statistics represent the mean value and standard deviation of three duplicates with a **P < 0.05 significance level for comparing them to the controls group.

