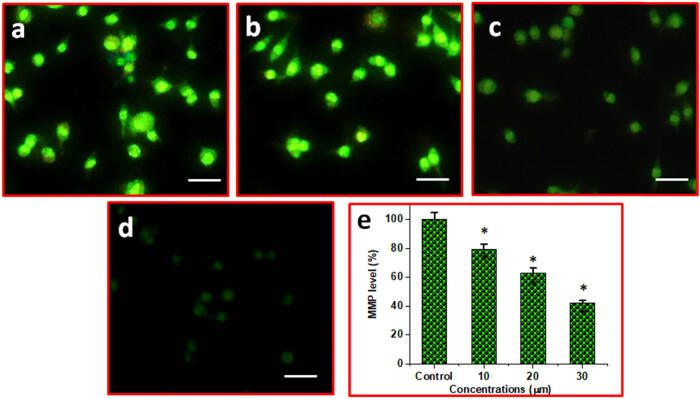
Figure 5.
The impact of DN and OA combo on MMP levels in A549 cells. (a) Control, (b) 10 µM DN and OA, (c) 20 µM DN and OA, and (d) 30 µM DN and OA. (e) Bar illustration corresponds to the % MMP levels in control, combination of 10, 20, 30 µM DN and OA treated cells. The scale bar displayed 50 µm. *P < 0.05 significance level for comparing them to the controls group.

