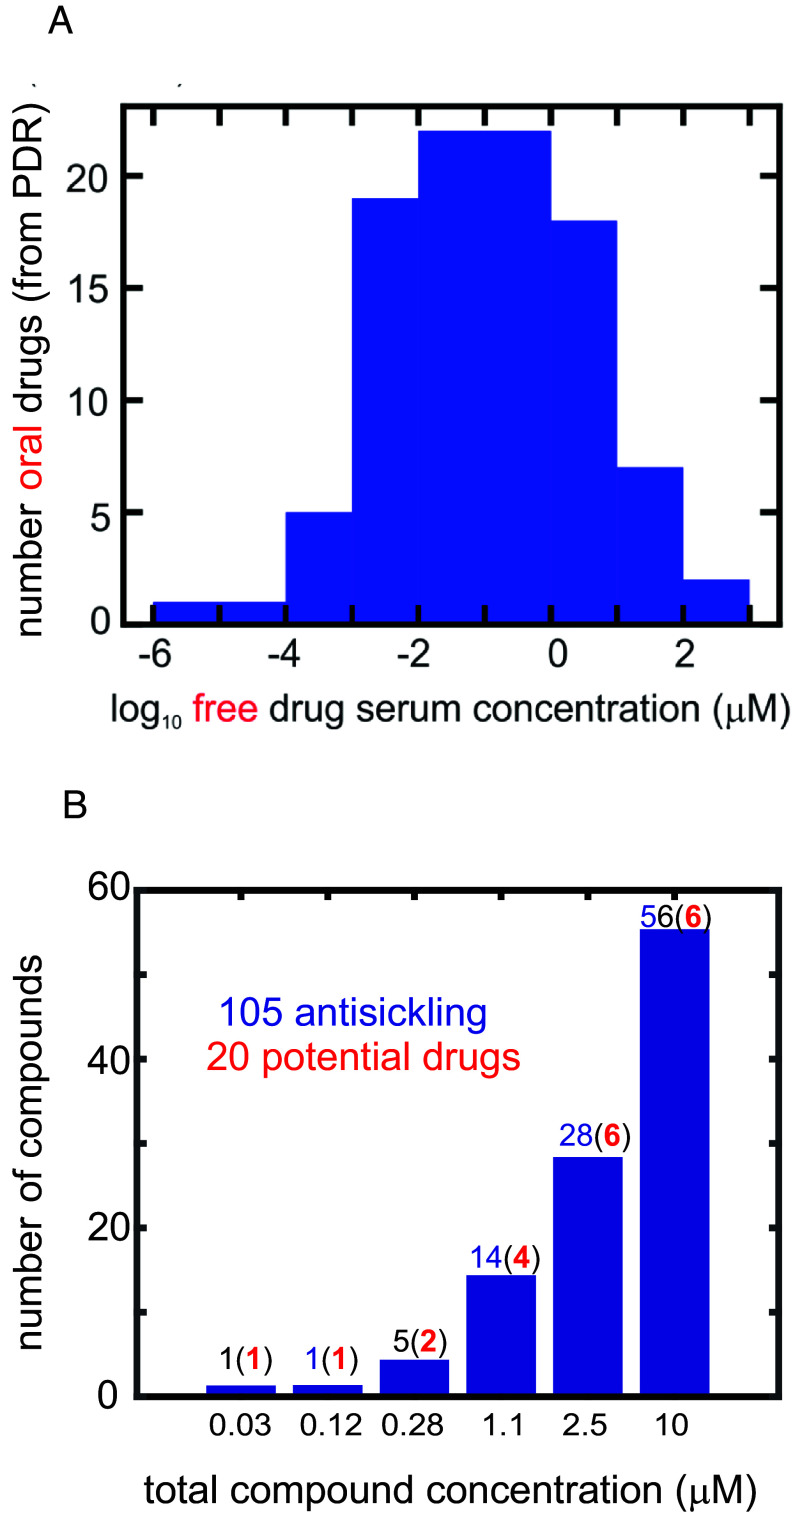
Fig. 5.
Comparing inhibitory concentrations in assay and oral drug concentrations in the PDR (one column figure). (A) Distribution of 97 free oral drug concentrations (Cmax) in the 2015 version of the PDR. The free concentration was given either explicitly in the PDR or obtained from the given total serum Cmax and the percentage bound to serum proteins. (B) Distribution of ReFrame total compound concentrations with statistically significant inhibition at each concentration, defined as . The red numbers in parentheses result from multiplying the number (in blue) of compounds by the fraction of oral drugs with that free concentration or higher from the distribution in Fig. 5A. For inhibitory mechanisms other than those resulting from binding to hemoglobin, the total compound concentration is also the free concentration. For compounds that inhibit by binding to hemoglobin, the free concentration is less than the total concentration. In the 2,000-fold diluted blood used for the assay, the hemoglobin molecule is at a concentration of ~1 μM, while the molar concentration of red cells is ~4 fM.

