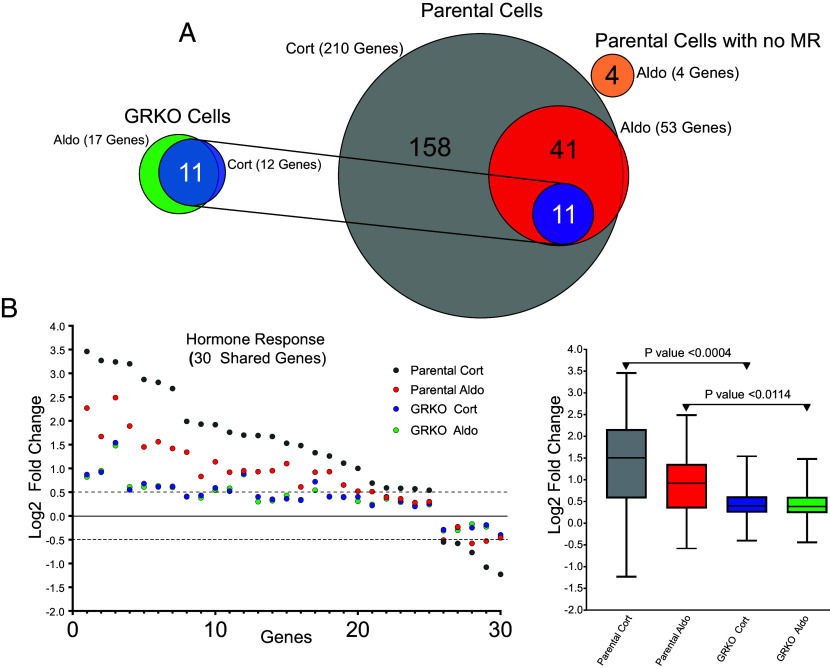
Fig. 1.
MR transcriptional response in the presence or absence of GR. (A) Venn diagrams of hormone-regulated protein-coding genes (2 h treatment/vehicle) to 100 nM Cort or 10 nM Aldo. Total number of hormone-responsive genes (FDR ≤ 0.01, Log2 FC ≥ ± 0.5) denoted in parentheses for MR-expressing GRKO cells, MR-expressing parental cells or parental cells without MR (data from 2 to 3 independent replicates). Circles connected with lines denote 11 hormone-responsive genes common to the two cell lines. (B) Scatter plot of Log2 FC for all shared genes meeting the FDR 0.01 cutoff, regardless of fold change. Box and whiskers plot of the same data displays interquartile range (IQR) depicting the 25th, 50th, and 75th percentile as box with the median as black bar. The whiskers mark the most induced and repressed genes. Statistical analysis was performed using a two-tailed unpaired t test.

