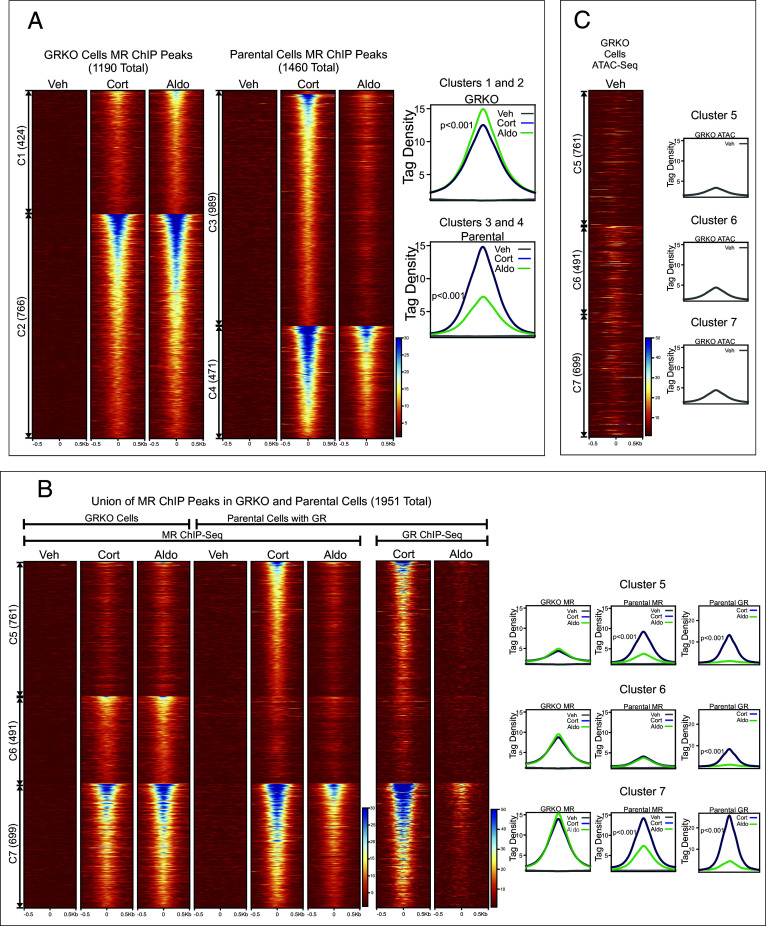
Fig. 2.
Chromatin binding of MR. (A) Comparison of MR binding after 1 h treatment with vehicle, 100 nM Cort, or 10 nM Aldo in two cell lines (GRKO with no GR or parental with endogenous GR; N = 2). Heatmaps of merged replicate data represent ±500 bp around the center of the MR peak. ChIP-seq intensity scale is noted Lower Right on a linear scale. Clusters of peaks (C1 to C4) are labeled on the left with the peak number in parentheses and are sorted from high to low signal for the condition with the highest overall signal. Aggregate plots represent total ChIP-seq tag density of all peaks normalized as reads per genomic content (1× normalization). Denoted P-values correspond to comparison of aggregate plots for Cort/Aldo treatments calculated using a Wilcoxon Signed-Rank test. (B) A union list of MR ChIP peaks from panel A was created (Materials and Methods) and clustered by cell line and hormone treatment. 1,951 unique MR peaks are distributed into parental-specific/Cort (C5), GRKO-specific/Aldo (C6), or shared between two cell types (C7). Aggregate plots and heatmaps are displayed as described for A for each cluster and treatment. (C) ATAC-seq data are from untreated GRKO cells with stably expressed GFP-GRwt (33). The ATAC data heatmap is sorted the same as ChIP data in B and intensity scale is noted Lower Right on a linear scale.

