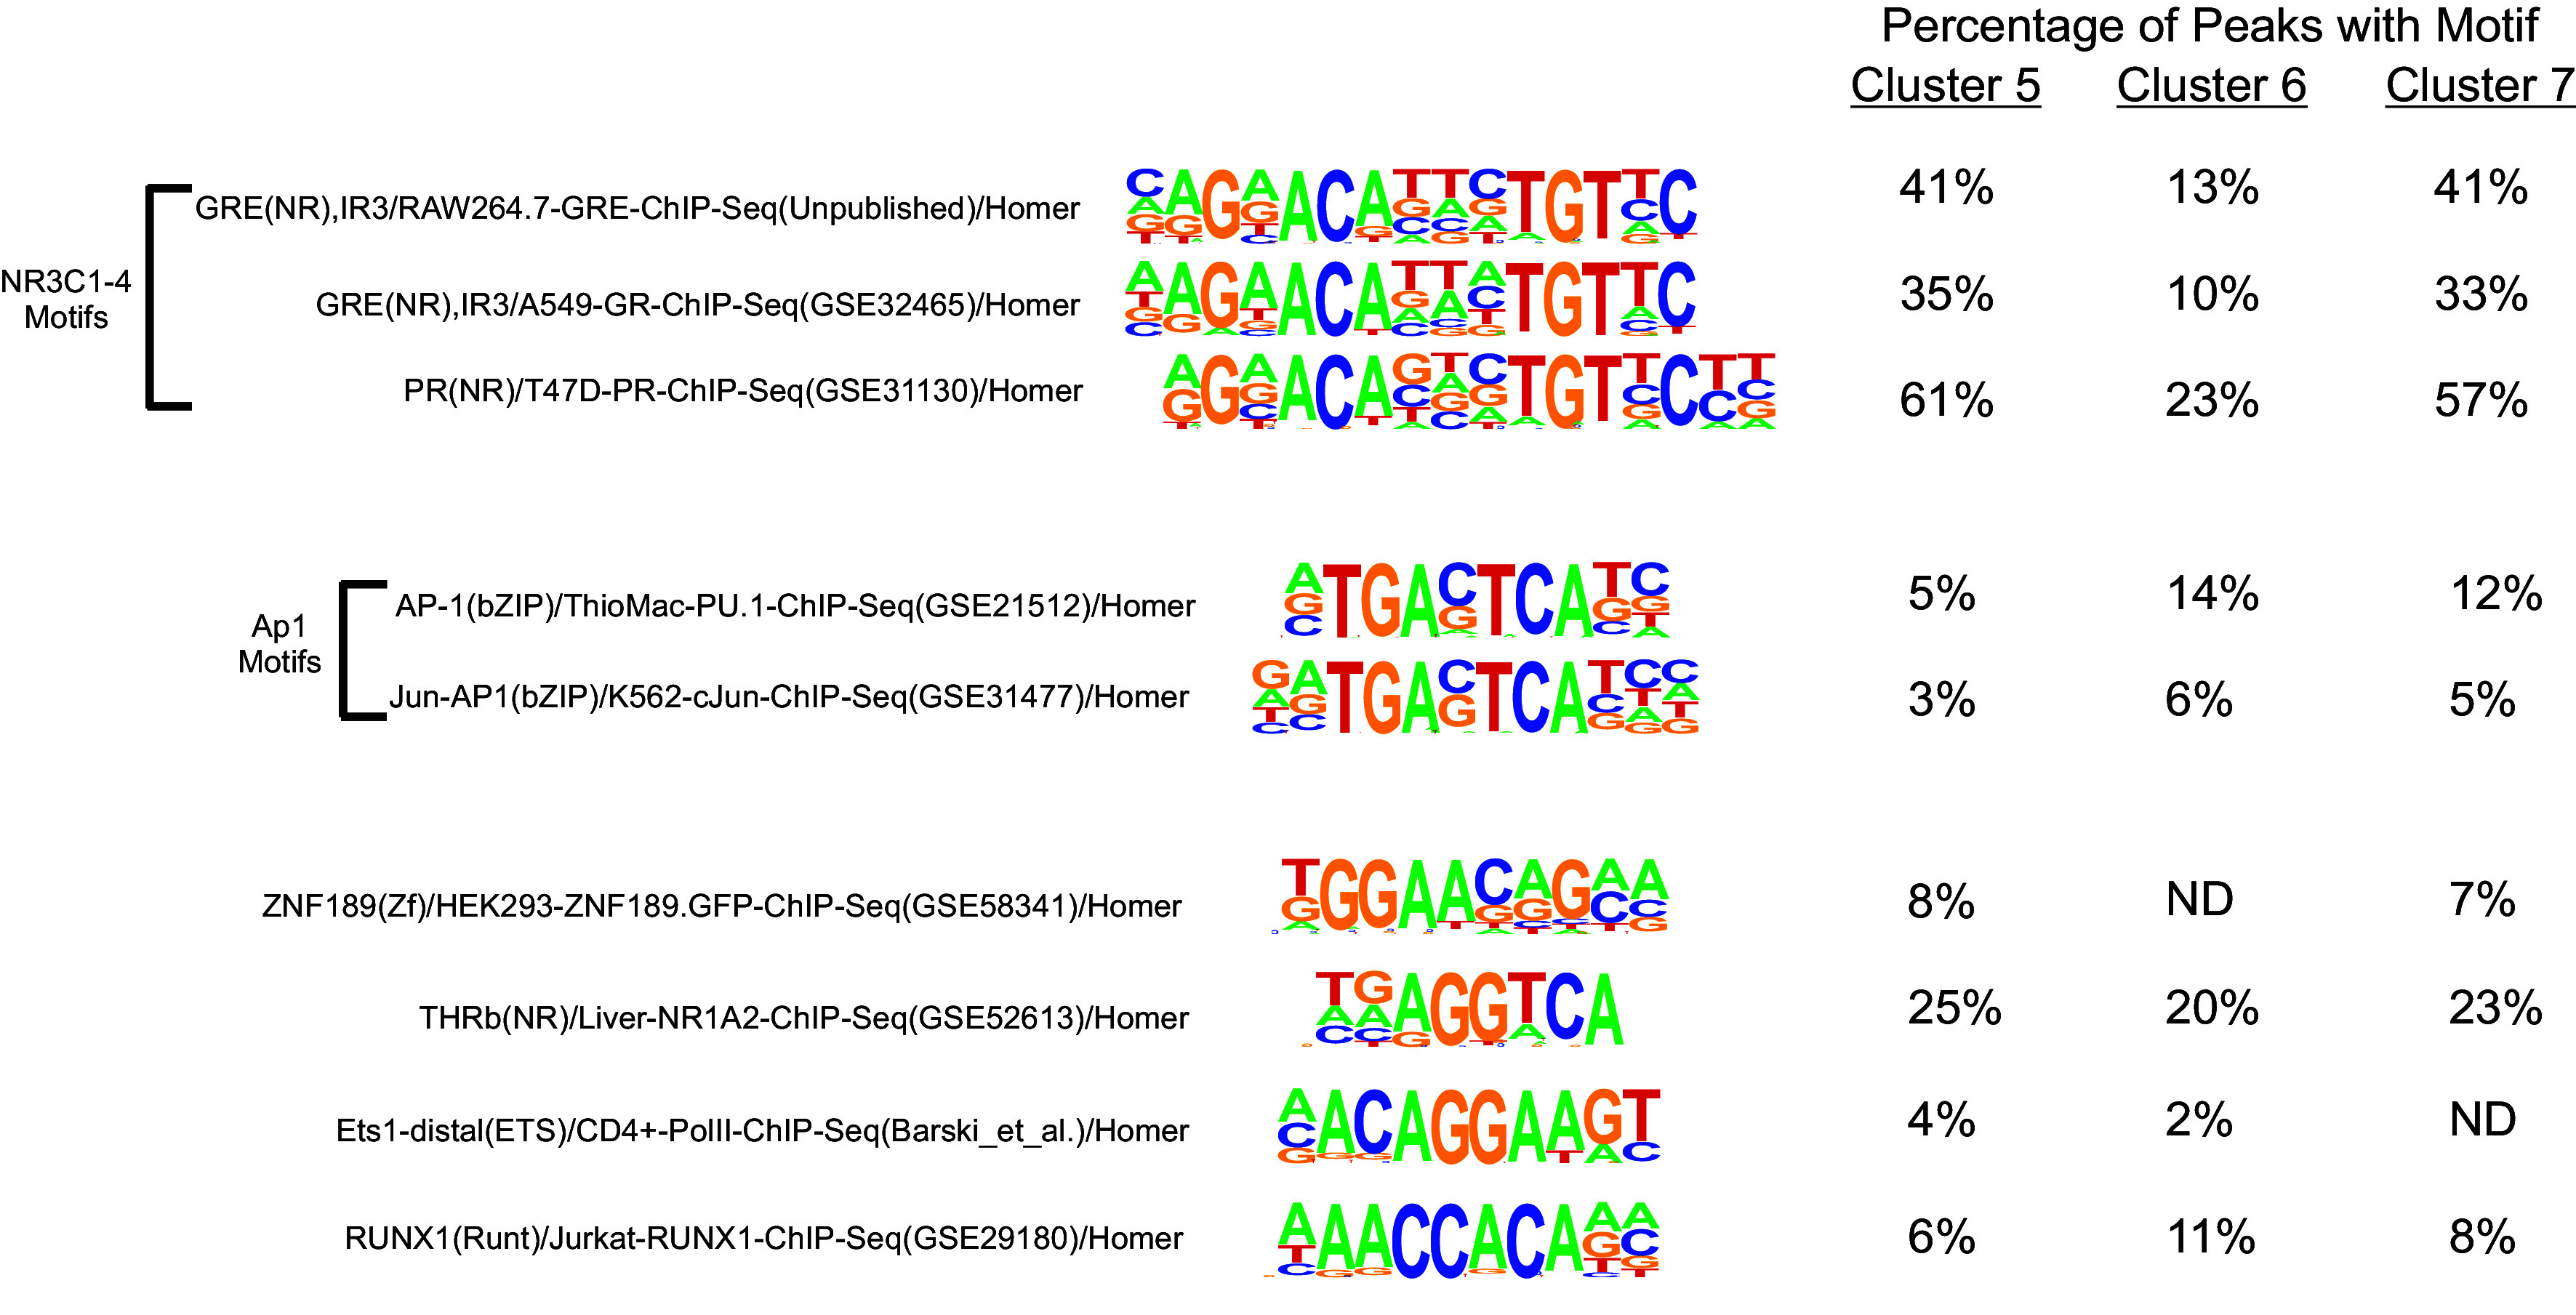
Fig. 3.

Motif analysis of MR binding. Figure shows position weight matrix logos for known motifs from the HOMER database. For Clusters 5 to 7, the percentage of MR binding sites that contain the designated known motif. See also Dataset S3 for numbers of sites containing a designated motif and background information.
