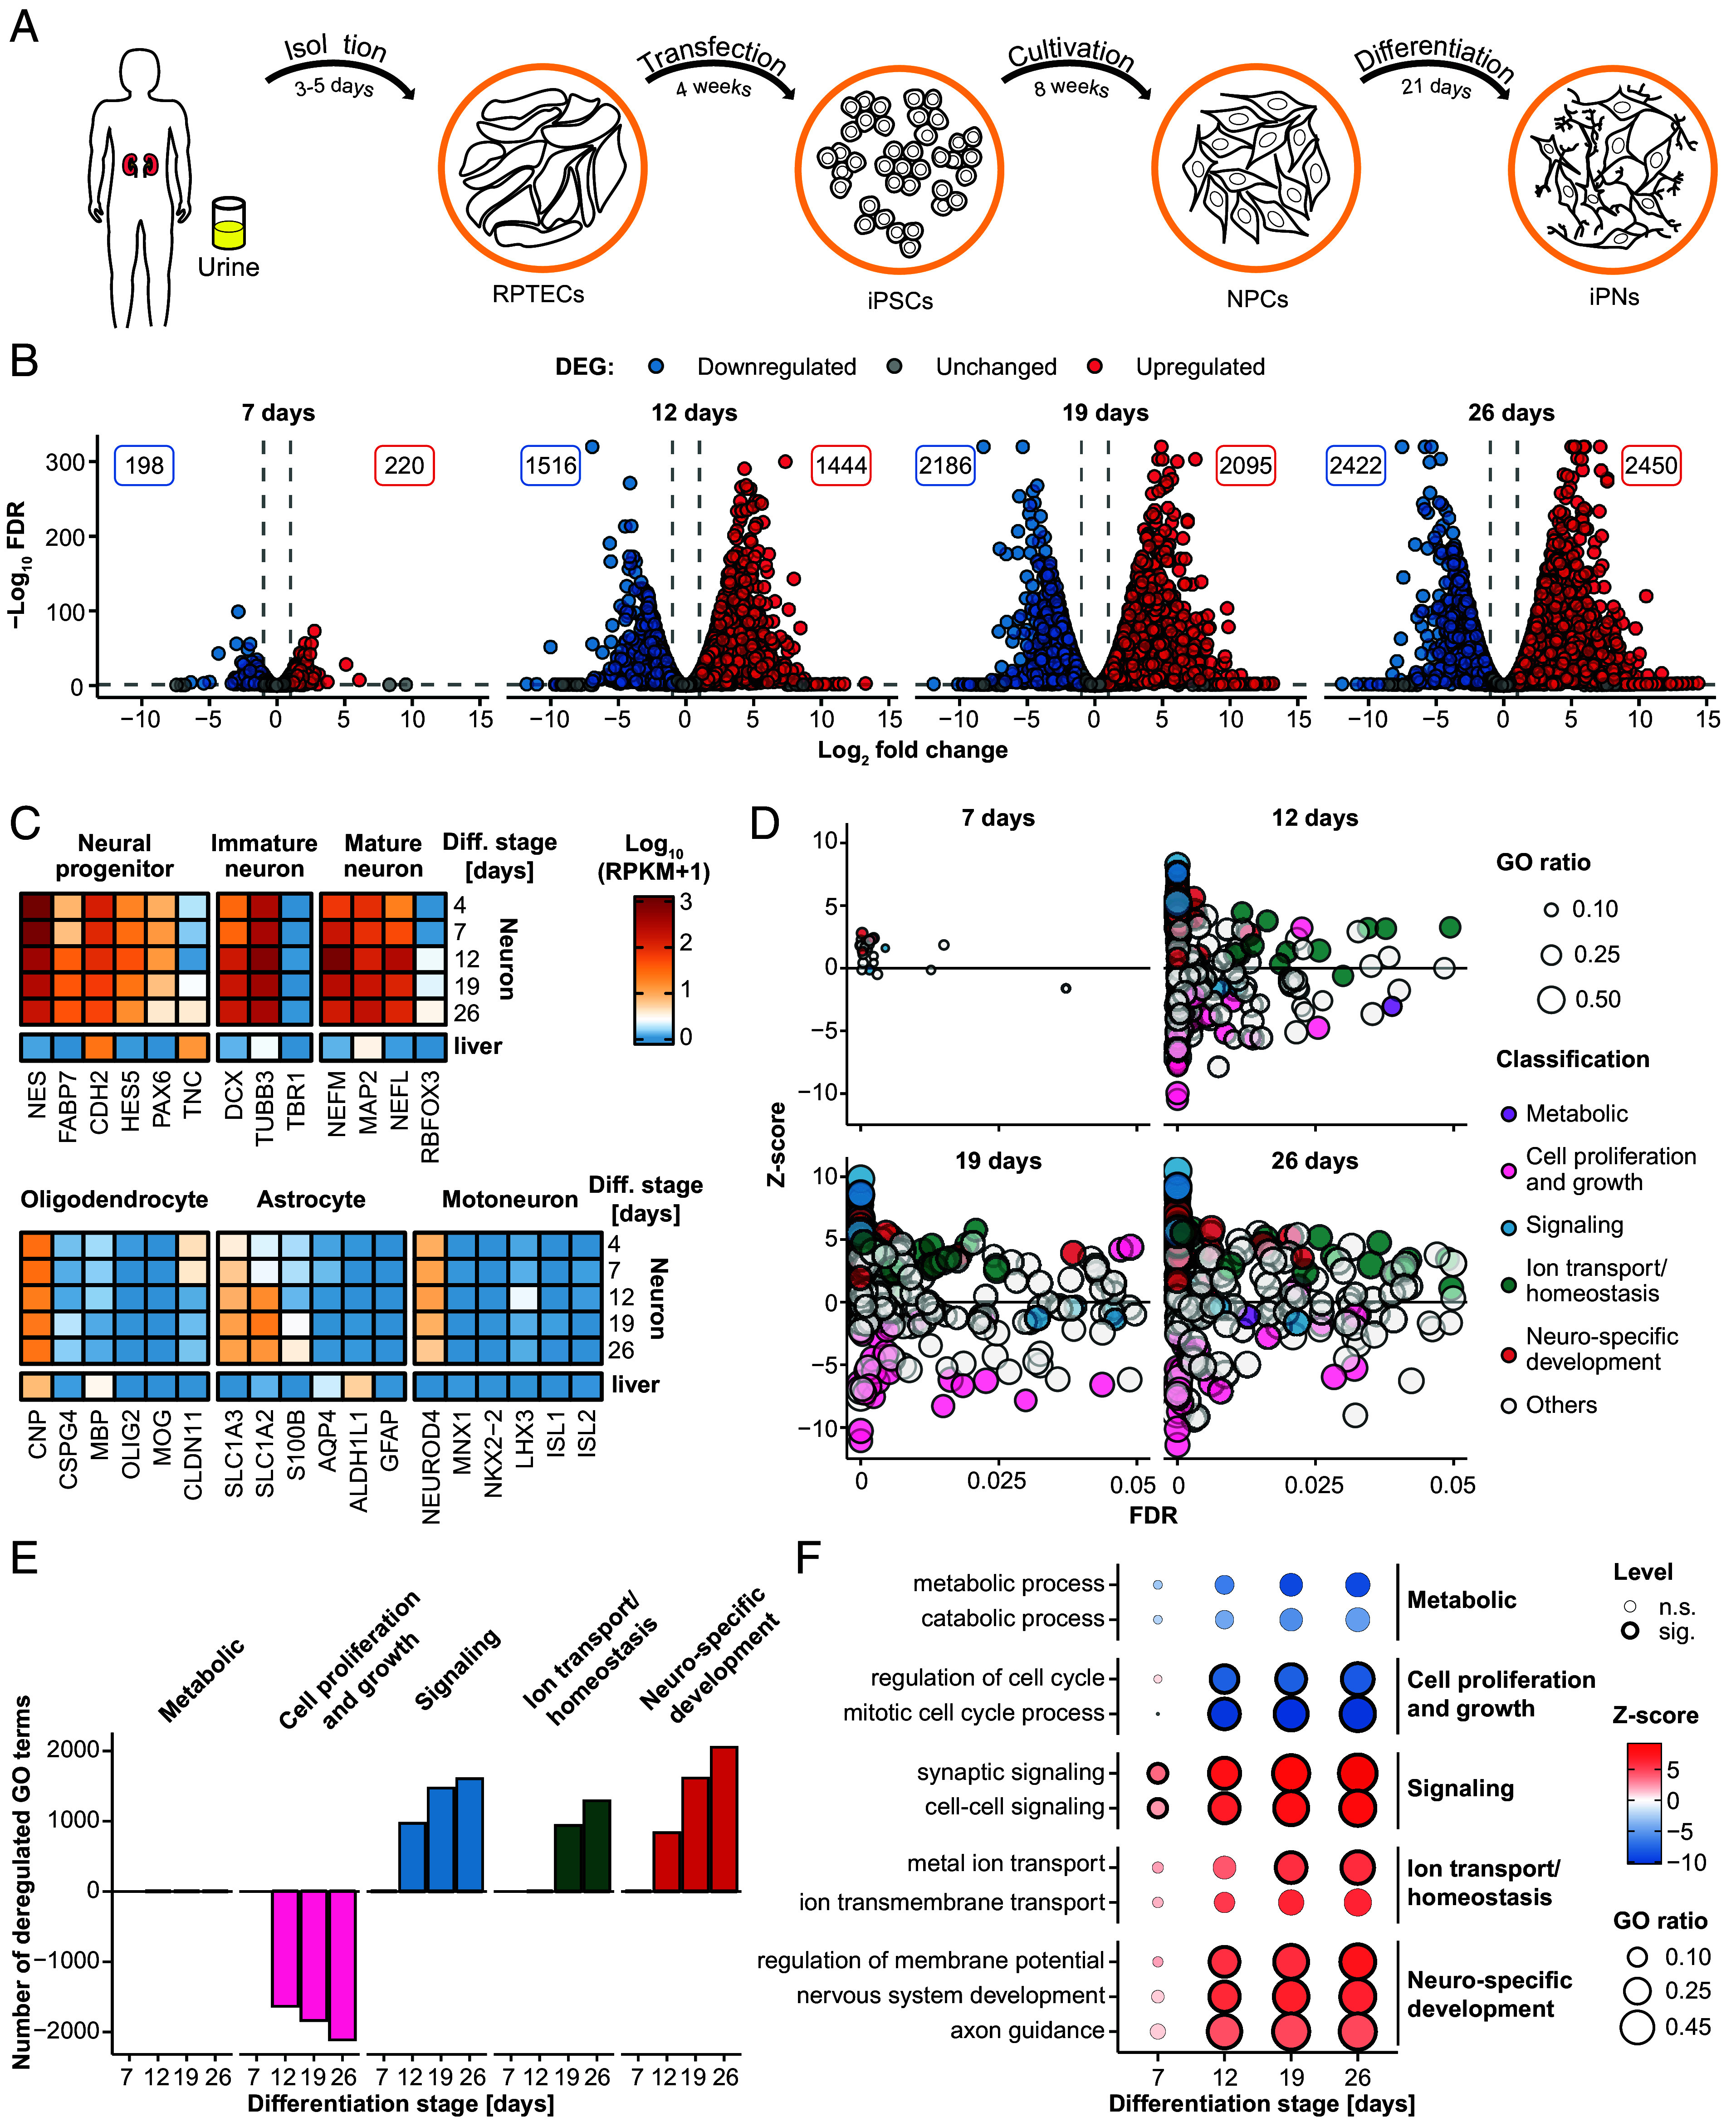
Fig. 1.

Characterization of induced human primary neurons as a model system for HEV. (A) First, RPTECs were isolated from human urine. The RPTECs were transfected with episomal vectors to iPSCs and further cultivation resulted in NPCs. iPNs were generated by differentiating the NPCs over 21 d. (B–F) Transcriptome analysis (Illumina sequencing) during the differentiation process with comparison of cells aged 7, 12, 19, and 26 d to the earliest time point of 4-d-old cells. (B) Volcano plots show the strength of deregulation during cell differentiation. Total number of significantly DEG, up-regulated (red), or down-regulated (blue), at different stages of differentiation. The threshold for DEG was set at a FC above 4 or below -4, a FDR with a minimum of 0.05 and RPKM of at least 0.5. (C) Expression pattern of marker genes for neuronal progenitors, immature neurons, mature neurons, oligodendrocytes, astrocytes, and motoneurons during the differentiation process. Color-code represents the log10 (RPKM+1) values. (D) Overview of the significantly deregulated GO terms classified into metabolic (purple), cell proliferation and growth (pink), signaling (blue), ion transport/homeostasis (green), and neuro-specific development (red) processes. The z-score (y-axis) indicates the activation or deactivation of GO terms and the dot size depicts the fraction of deregulated genes per term. (E) Quantification of significantly deregulated GO terms associated with metabolic processes, cell proliferation, signaling pathways, ion transport/homeostasis, and neuro-specific development compared across different stages of cellular differentiation. Threshold for GO term activation or deactivation was set at P value <= 0.05 and term size of at least 30 genes. (F) Selected GO terms, encompassing metabolic processes, cell proliferation and growth, signaling pathways, ion transport/homeostasis, and neuro-specific development, were investigated across various time points of differentiation. The dot color reflects whether a term is activated or deactivated (z-score). The GO ratio indicates the number of deregulated genes per term and the dot border is a binary indicator for a significant (FDR < = 0.05) deregulation. n.s: not significant; sig: significant.
