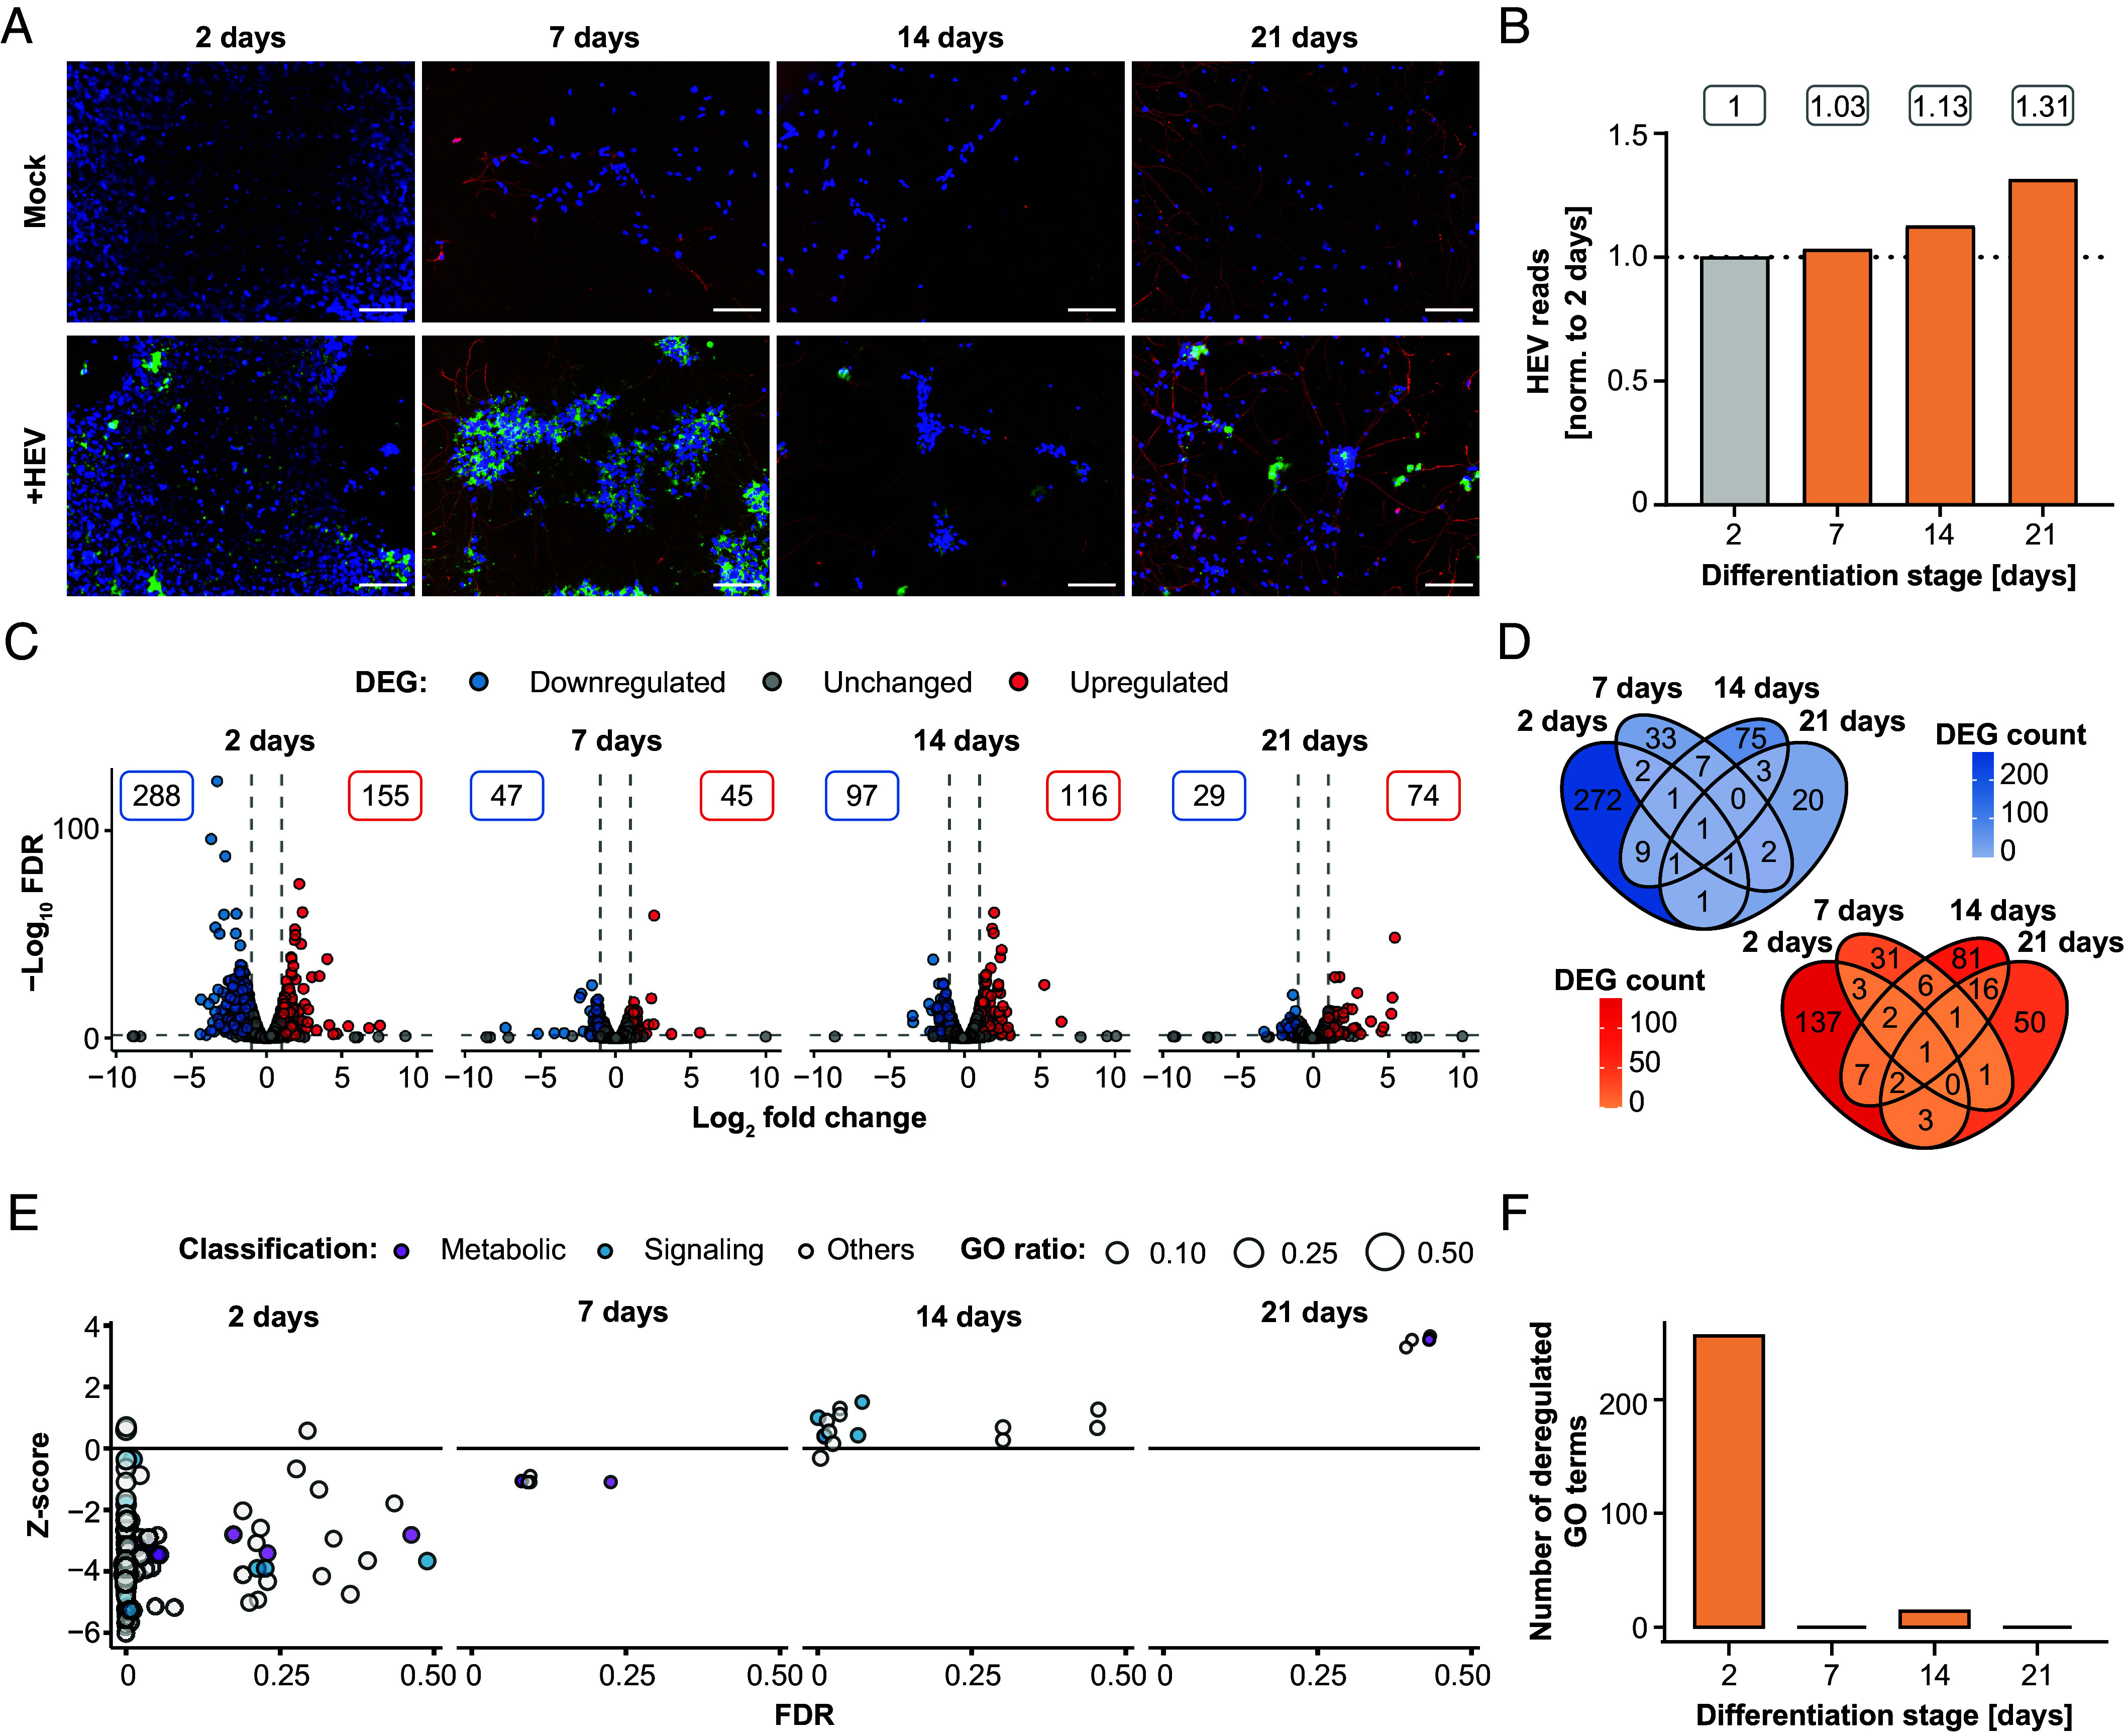
Fig. 3.

RNA sequencing analysis of cellular response to HEV infection in iPNs. (A) Along the differentiation process from neural progenitor cells to mature neurons, differentiating cells were infected with HEV at defined time points of 2, 7, 14, and 21 d after the initiation of the differentiation process. Five-days postinoculation, immunofluorescence staining was performed for uninfected (Mock) and infected (+HEV) cells using a polyclonal rabbit anti-HEV antibody for the ORF2 capsid protein (green), β-III-tubulin for the cytoskeleton (red) and DAPI for the nucleus (blue). Scale bars represent 100 µm. (B–F) Illumina RNA sequencing analysis was conducted on samples obtained from both uninfected and HEV-infected cells after a 5-d infection period, encompassing various differentiation stages (2, 7, 14, 21 d), followed by comparative assessment at each time point to elucidate differences in gene expression profiles between uninfected and HEV-infected neurons. (B) The depicted values represent the FC of HEV reads, normalized to total reads, across different stages of differentiation normalized to cells aged 2 d. (C) Volcano plots show the strength of deregulation under HEV infection with the total number of significantly DEG, up-regulated (red), or down-regulated (blue). The threshold for DEG was set at an absolute FC of 2, a FDR < 0.05 and max group expression of 2 transcript per million. (D) Venn diagram of significantly up-regulated (red) and down-regulated DEGs (blue) through HEV infection. (E) Overview of deregulated GO terms classified into metabolic (purple) and signaling (blue) processes. The z-score (y-axis) shows the up- or downregulation and dot size indicates the number of DEGs per term. (F) Quantification of the significantly deregulated GO terms with an FDR under 0.05 for each time point.
