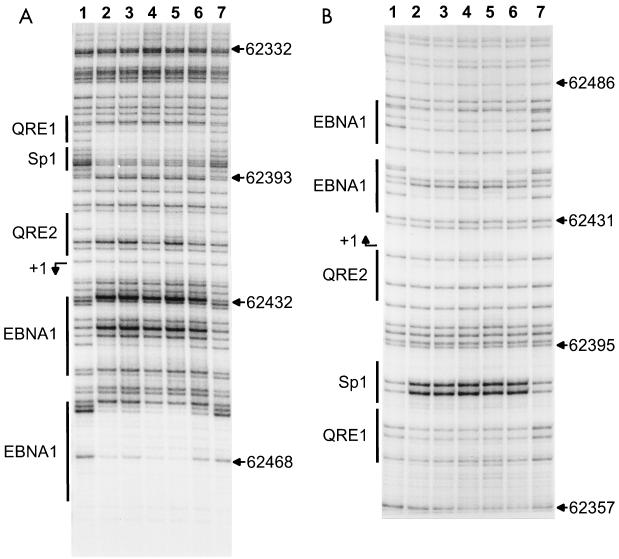
FIG. 4.
Genomic footprint analyses of Qp. (A) Upper strand, (B) Lower strand. Lane 1, G track from LCL 721 DNA; lanes 2 to 6, footprints. Lane 2, LCL 721 cells; lane 3, Mutu III cells; lane 4, Rael cells; lane 5, Raji cells; lane 6, Mutu I cells; lane 7, G track from Mutu I DNA. At the left of each panel, the locations of in vivo footprints and previously described in vitro binding sites are indicated by vertical bars; at the right of each panel, nucleotide numbers are given according to the EBV sequence of Baer et al. (4).

