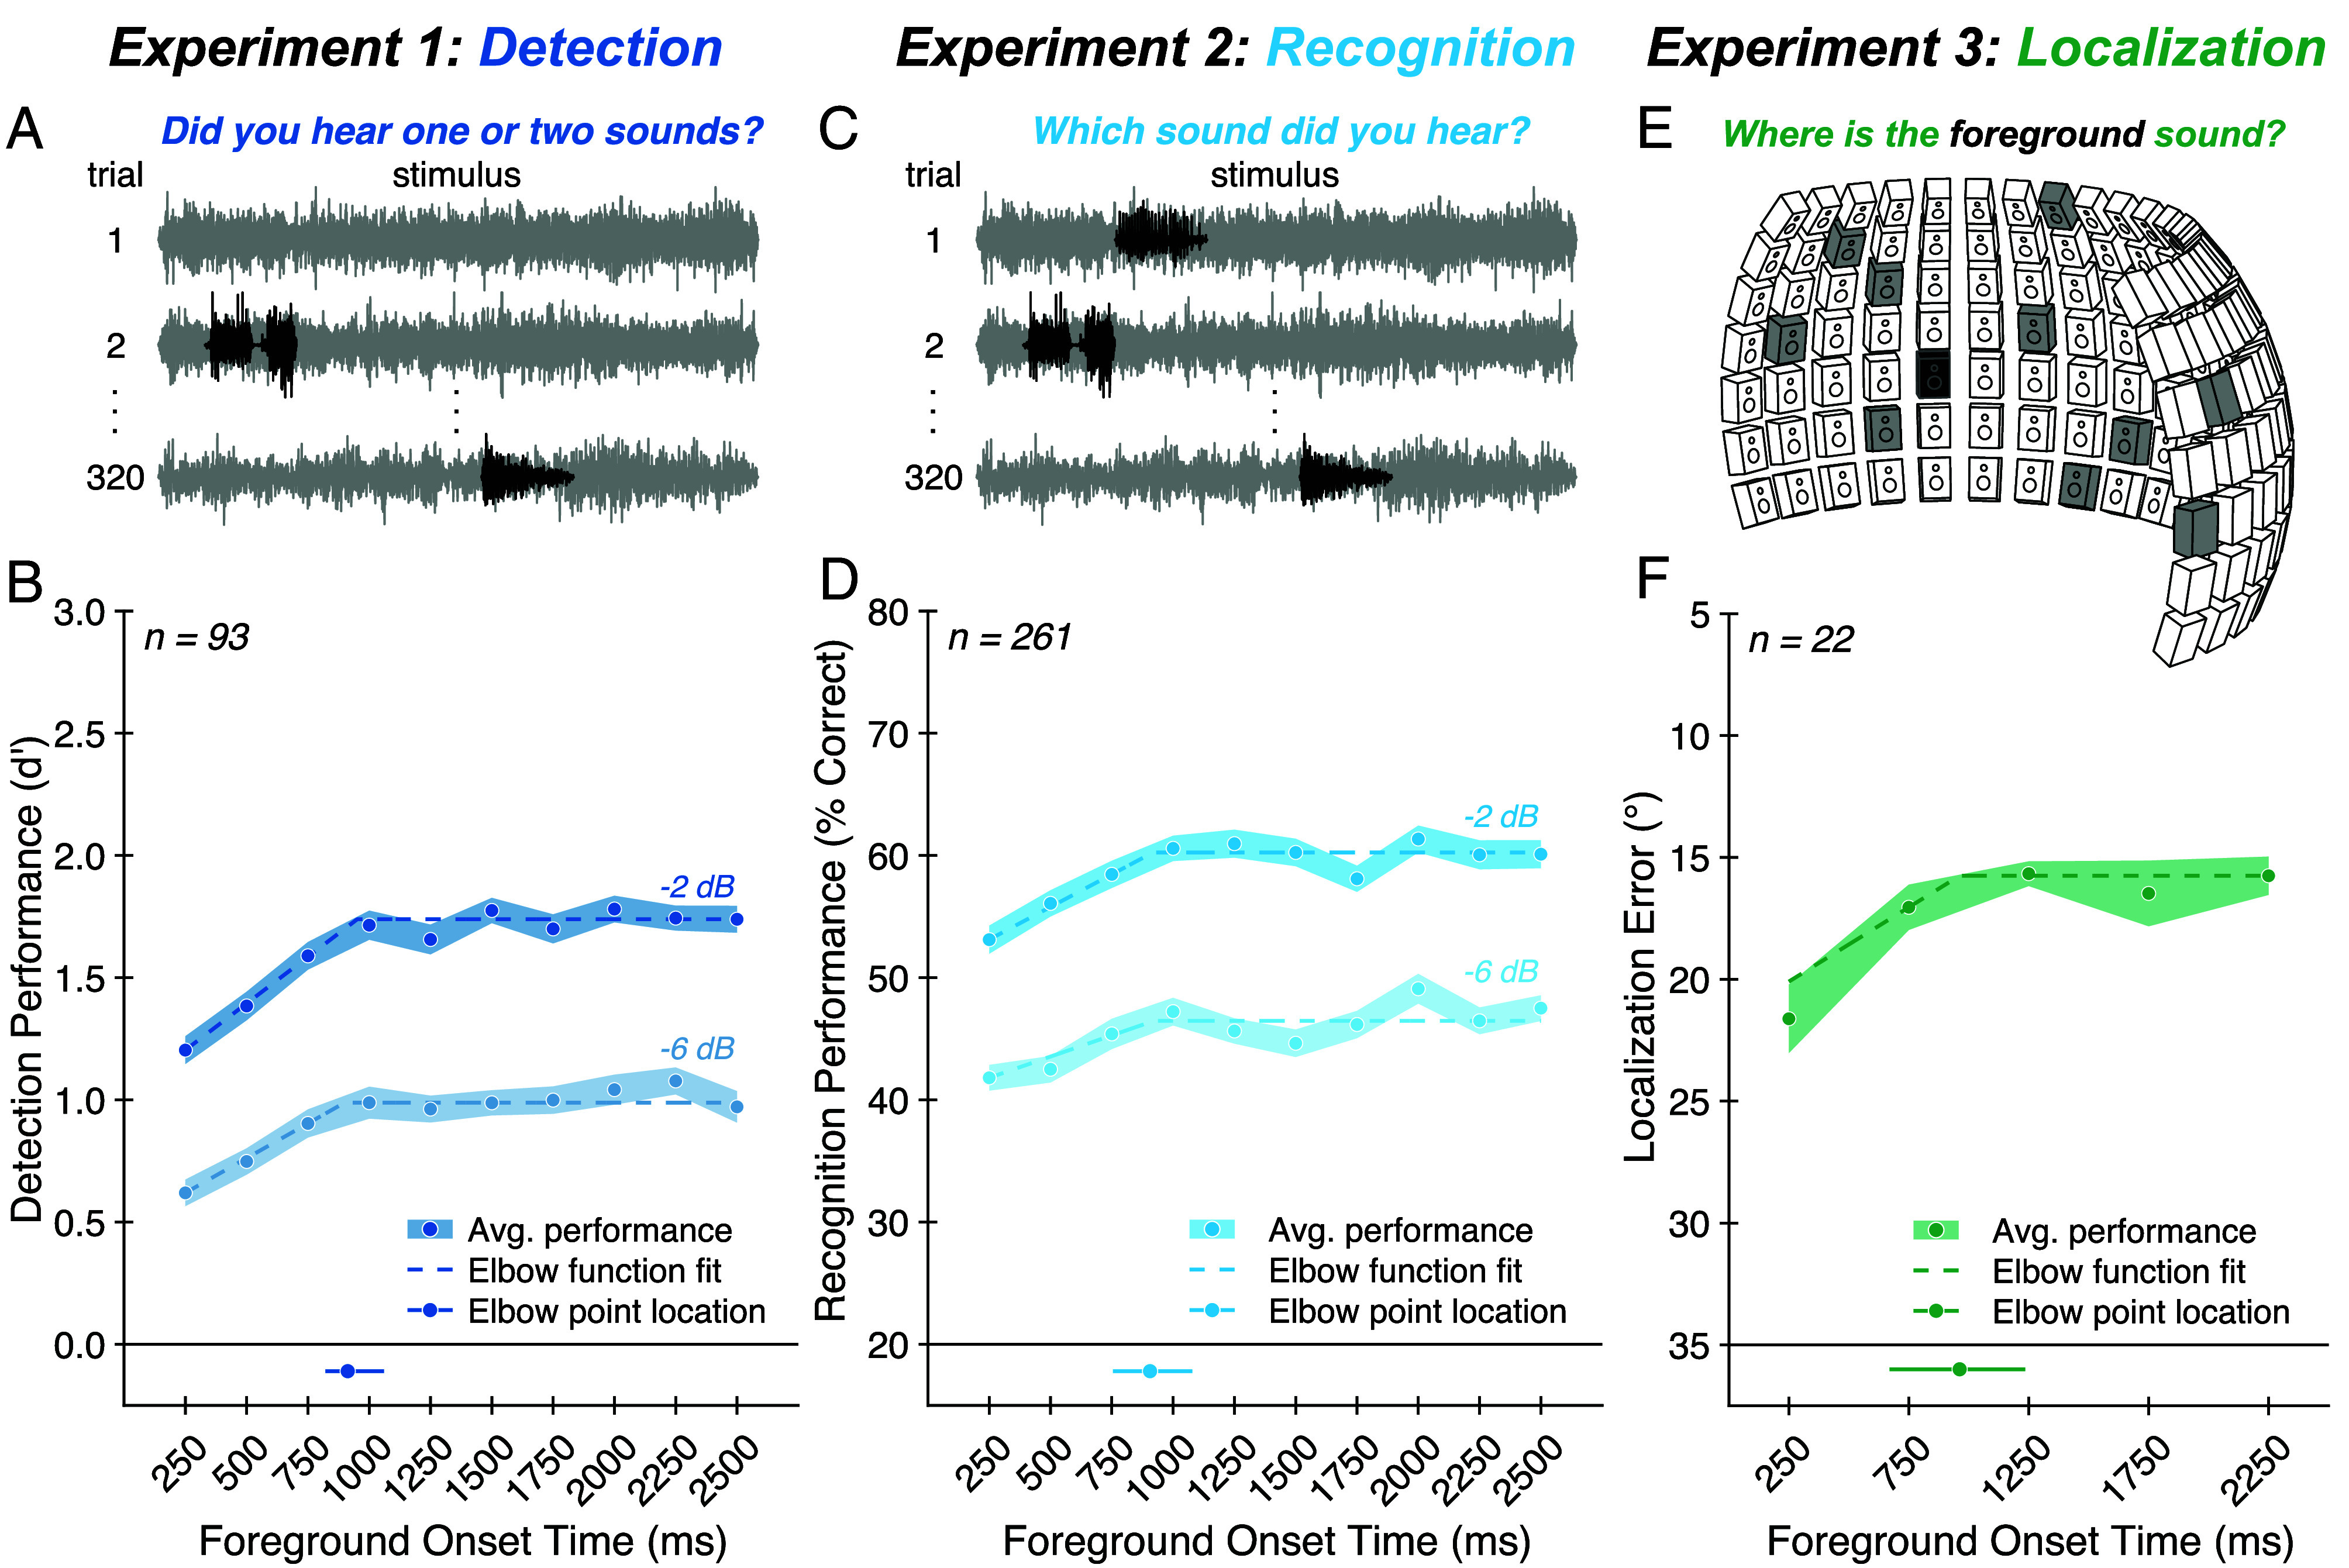
Fig. 2.

Experiments 1 to 3: Foreground detection, recognition, and localization improve with exposure to background noise. (A) Experiment 1 task. On each trial, participants heard a continuous background noise (gray) presented either in isolation (e.g., trial 1) or with a brief additional foreground sound (black) superimposed (e.g., trial 2). We manipulated the onset time and SNR of the foreground relative to the background. Participants judged whether the stimulus contained one or two sound sources. (B) Experiment 1 results. Average foreground detection performance (quantified as d′; blue circles) is plotted as a function of SNR and foreground onset time. Shaded regions plot SE. Dashed lines plot elbow function fit. The solid line below the main axis plots one SD above and below the median elbow point, obtained by fitting elbow functions to the results averaged over SNR and bootstrapping over participants; the dot on this line plots the fitted elbow point from the complete participant sample. (C) Experiment 2 task. On each trial, participants heard background noise (gray) containing a foreground sound (black) and were asked to identify the foreground by selecting a text label from five options. (D) Experiment 2 results. Foreground recognition performance (quantified as percent correct; blue circles) is plotted as a function of SNR and foreground onset time. Chance performance was 20%. Data are plotted using the same conventions as (B). (E) Experiment 3 task. Stimuli were presented via an array of 133 speakers spanning −90° to +90° in azimuth and −20° to +40° in elevation. On each trial, participants heard a scene composed of diffuse background noise (different samples of a texture played from 10 randomly selected speakers, shown in gray in the diagram) and a foreground sound (played from a randomly selected speaker, show in black in the diagram) occurring at one of five temporal positions within the noise. Participants judged the location of the foreground sound. (F) Experiment 3 results. Average foreground localization performance (quantified as absolute localization error in azimuth, in degrees; green circles) is plotted as a function of foreground onset time. The y axis is oriented to match conventions in other panels where higher positions along the ordinate indicate better performance. Data are plotted using the same conventions as (B).
