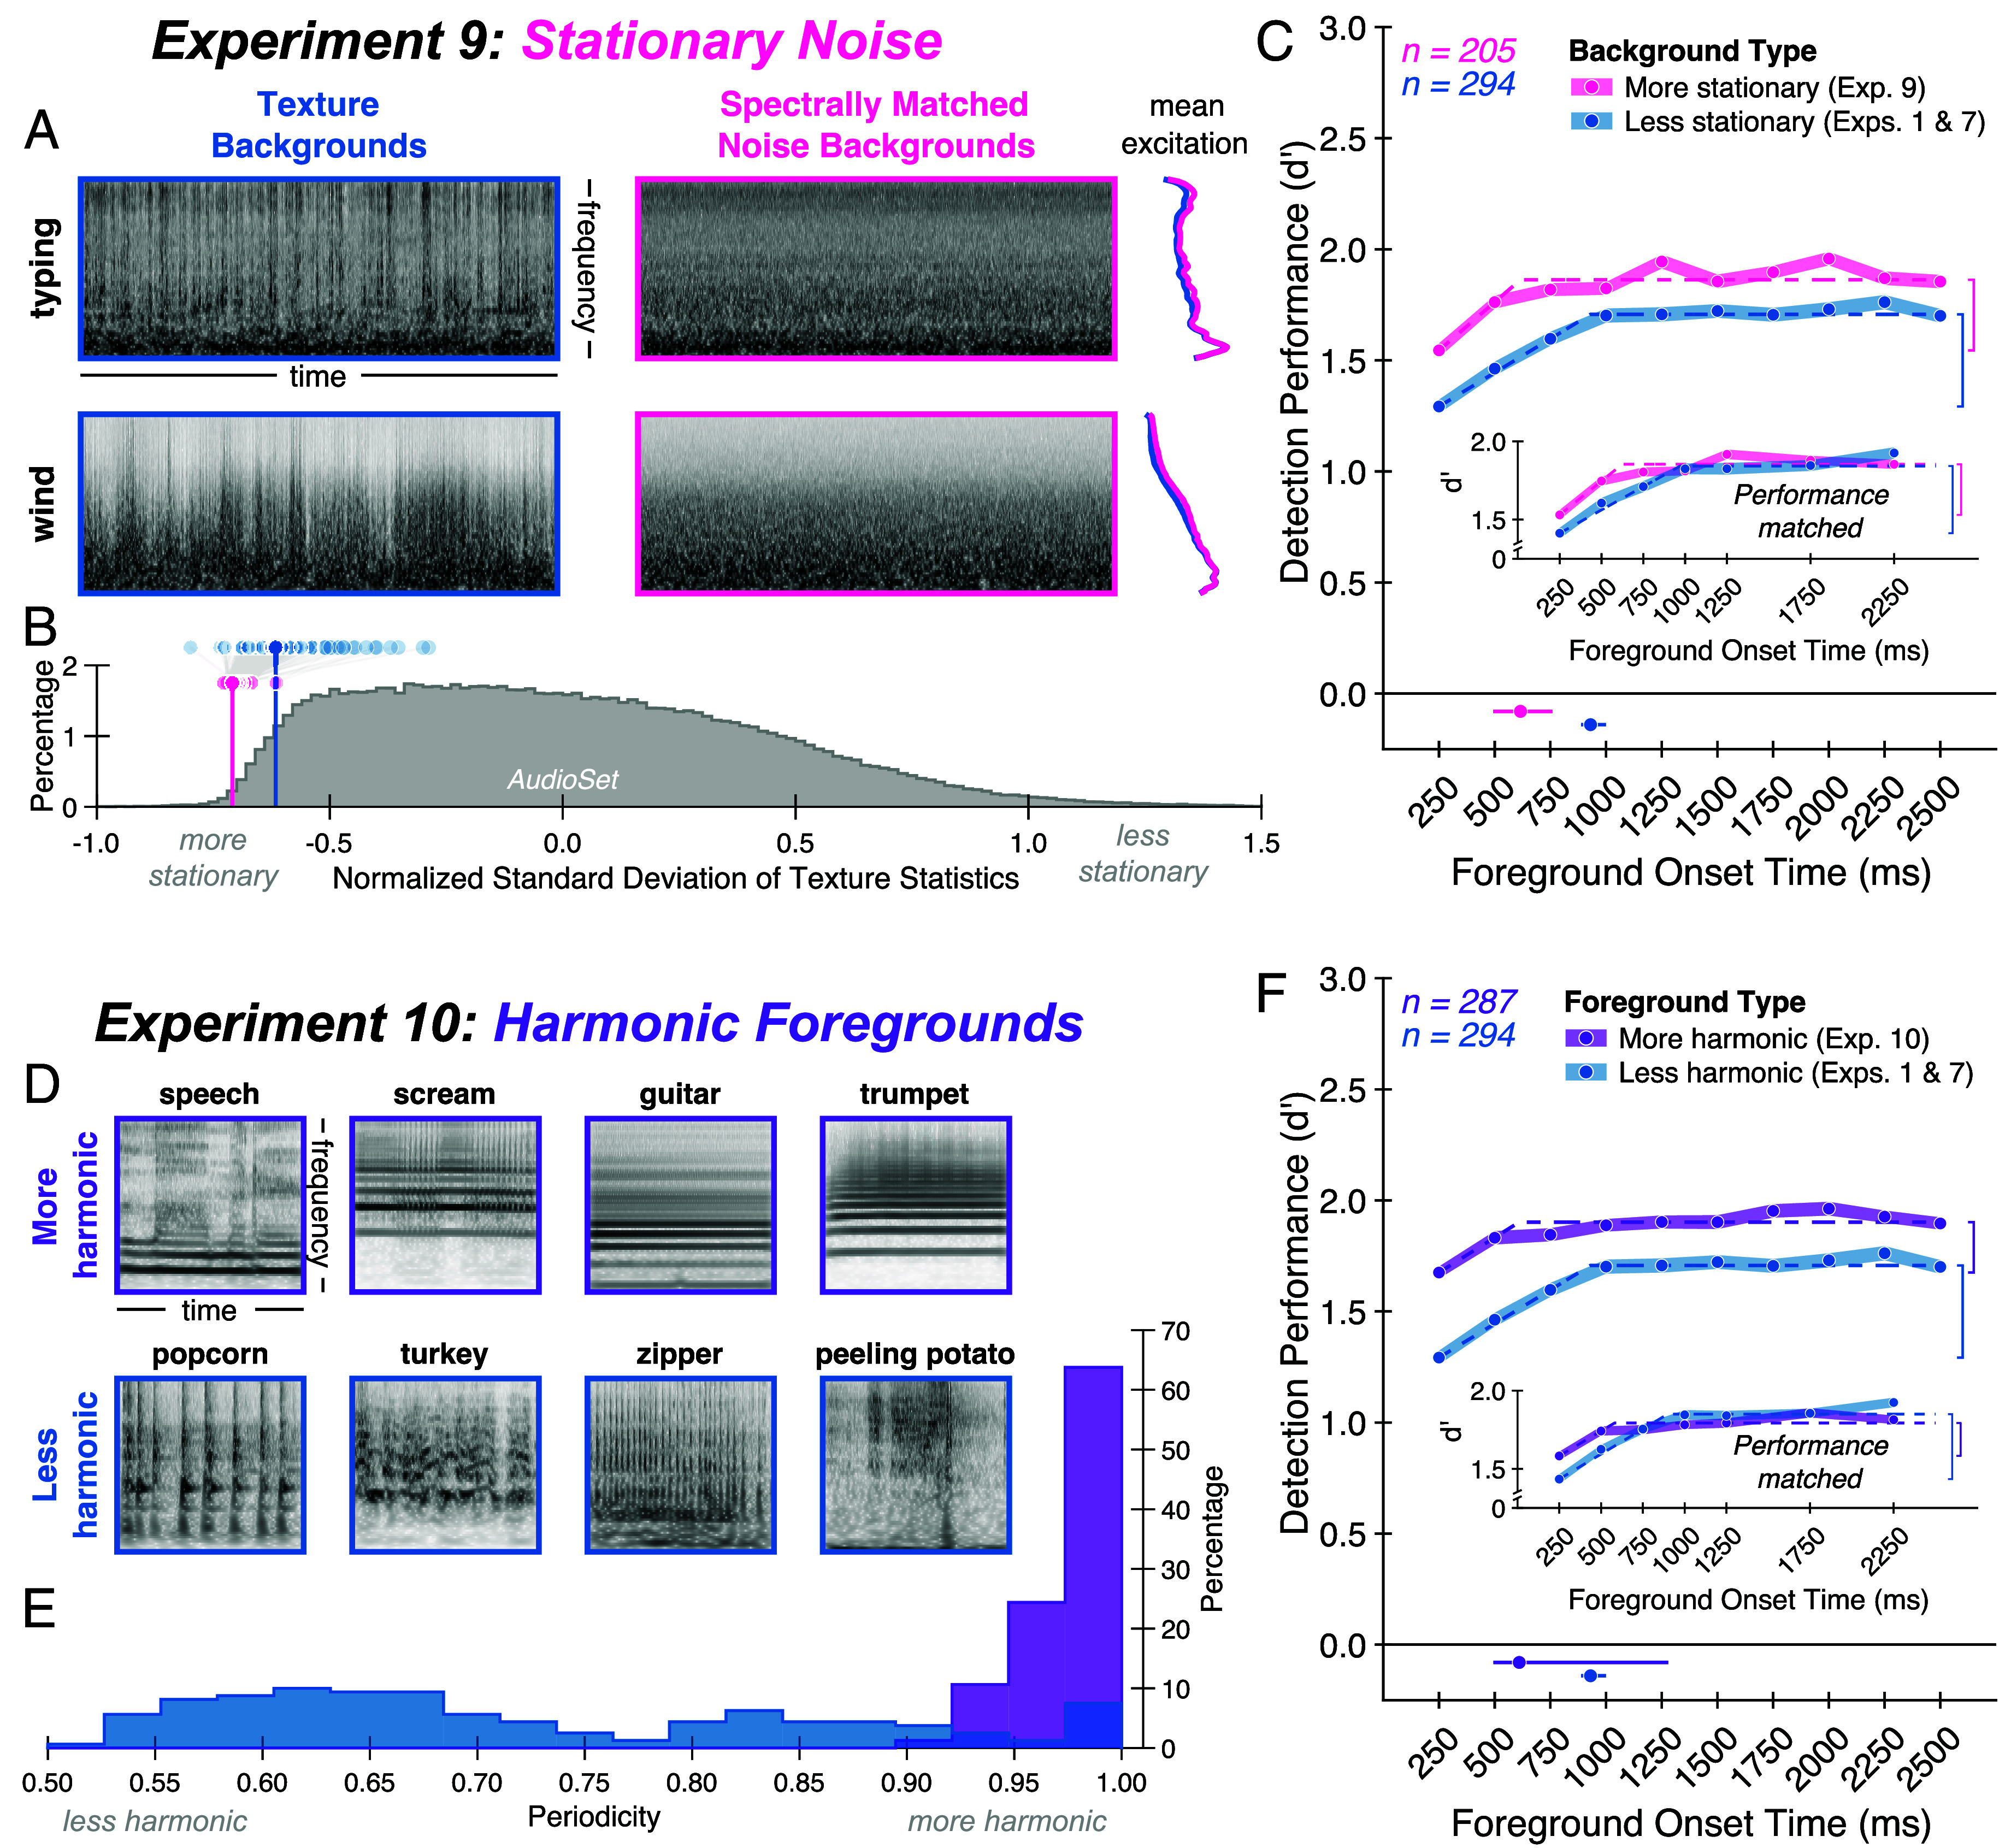
Fig. 6.

Experiments 9 and 10: Benefit of background exposure is reduced for stationary noise and harmonic foregrounds. (A) Example background noises from Experiment 9. The real-world texture backgrounds (Left, blue) used in Experiments 1 to 8 were replaced with spectrally matched noise (Middle, pink) to increase the noise stationarity. Backgrounds are displayed as cochleagrams (with darker gray indicating higher intensity) and mean excitation patterns (Right). (B) Stationarity of background noises. Shaded circles indicate a measure of stationarity (SD of texture statistics over time, normalized to account for increased variability of some statistics relative to others; Materials and Methods) for the texture backgrounds used in Experiments 1 to 8 (shown in blue) and the spectrally matched noise backgrounds used in Experiment 9 (shown in pink). Gray lines connect textures to their spectrally matched counterparts, illustrating that the spectrally matched noise is generally more stationary than its texture counterpart. Vertical lines indicate mean stationarity of background noises in each stimulus set. For comparison, a histogram of stationarity scores calculated from a large set of YouTube soundtracks (AudioSet; Materials and Methods) is shown in dark gray. Both sets of background noises are more stationary than the average soundtrack. (C) Experiment 9 results. Average foreground detection performance (quantified as d′) is plotted as a function of foreground onset time for more stationary (pink circles) versus less stationary (blue circles; obtained from pooled results of Experiments 1 and 7) backgrounds. Shaded regions plot SE. Dashed lines plot elbow function fit. Vertical brackets denote the delay benefit. Solid lines below the main axis plot one SD above and below the median elbow points, obtained by bootstrapping over participants; dots on these lines plot the fitted elbow points from the complete participant samples. The Inset shows results after matching asymptotic performance across groups of participants. (D) Example foreground sounds from Experiment 10. The foreground sounds used in Experiments 1 to 9 (Bottom, blue) were replaced with human vocalizations and musical instrument sounds (Top, purple). Foregrounds are displayed as cochleagrams. (E) Harmonicity of foregrounds. Harmonicity was quantified with a measure of waveform periodicity (Materials and Methods). Histograms of periodicity are shown for the set of human vocalizations and instrument sounds used in Experiment 10 (purple) and for the set of foregrounds used in Experiments 1 to 9 (blue). (F) Experiment 10 results. Average foreground detection performance (quantified as d′) is plotted as a function of foreground onset time for more harmonic (purple circles) versus less harmonic (blue circles; obtained from pooled results of Experiments 1 and 7) foregrounds. Conventions same as (C).
