Fig. 1.

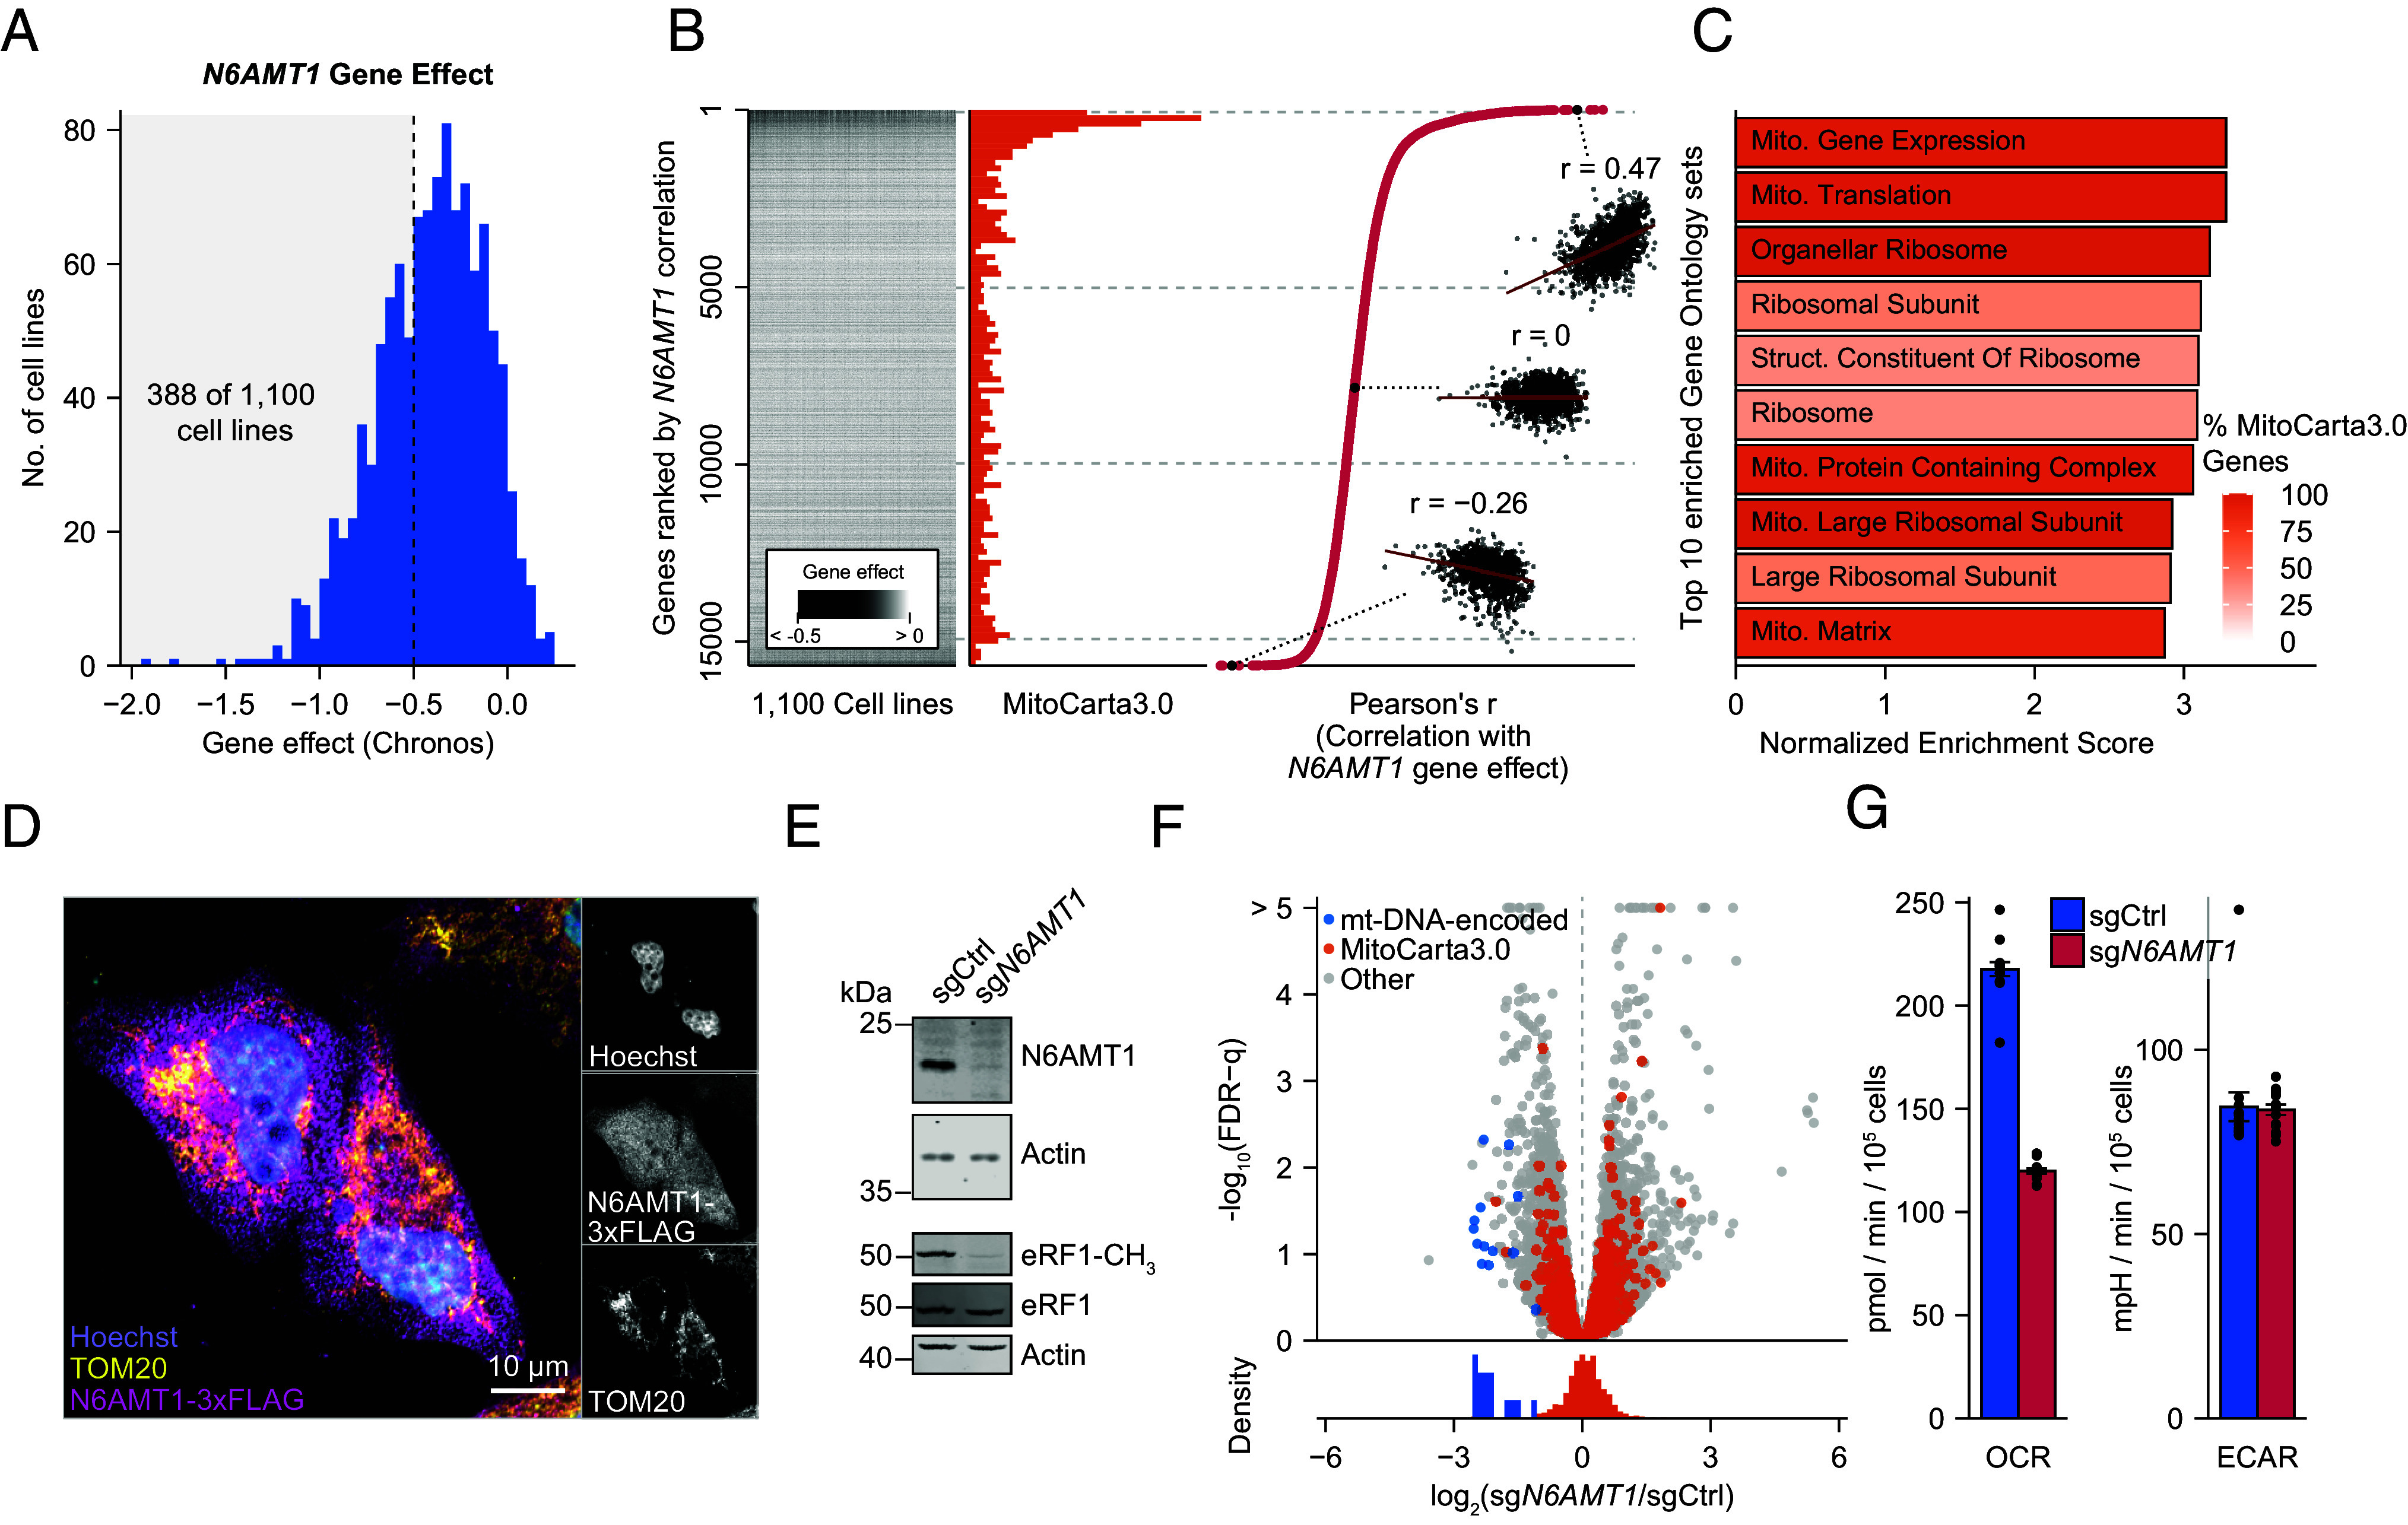
The mitochondrial impact of N6AMT1 is independent of nuclear transcription. (A) Cell line distribution of N6AMT1 Chronos scores across 1,100 cell lines of the CCLE. Density represents the relative number of cell lines with an N6AMT1-gene effect score within the range of each bin. The shaded area represents highly N6AMT1-dependent cell lines (388 of 1,100 cell lines with Chronos score <−0.5). (B) Analysis of N6AMT1 gene effect correlations. Gene-effect scores (Chronos scores; Left) of 15,677 nonessential genes in 1,100 cell lines from the CCLE were correlated with N6AMT1 gene effects and ranked according to Pearson correlation coefficients (Right). The distribution of MitoCarta3.0 genes is indicated in the Middle panel. Inserts show example correlations between N6AMT1 and three arbitrarily selected genes. Pearson correlation coefficients are listed in Dataset S1. (C) Top 10 enriched gene sets from Gene Ontology term-based GSEA of correlation coefficients shown in (B). Color shade indicates the percentage of MitoCarta3.0 genes in each gene set. (D) Immunofluorescence analysis of N6AMT1 localization. HeLa cells were transduced with N6AMT1-3xFLAG cDNA and immunolabeled with anti-FLAG and anti-TOM20 (a mitochondrial marker). Nuclei were visualized by Hoechst staining. (E) Immunoblot analysis of N6AMT1, methylated eRF1 (eRF1-CH3), and total eRF1 protein levels in control (sgCtrl) and N6AMT1-depleted (sgN6AMT1) K562 cells. (F) Transcriptomic analysis of 11,285 transcripts in N6AMT1-depleted K562 cells highlighting MitoCarta3.0 (orange) and mitochondrial DNA (mtDNA)-encoded ORFs (blue). False discovery rate (FDR) was calculated according to the method of Benjamini and Hochberg. n = 3 independent lentiviral transductions per condition. (G) Representative basal oxygen consumption rate (OCR) and ECAR per 10,000 cells in N6AMT1-depleted K562 cells. Bars represent mean values (n = 15 replicate wells, representative of ≥3 independent experiments), and error bars represent SEM.
