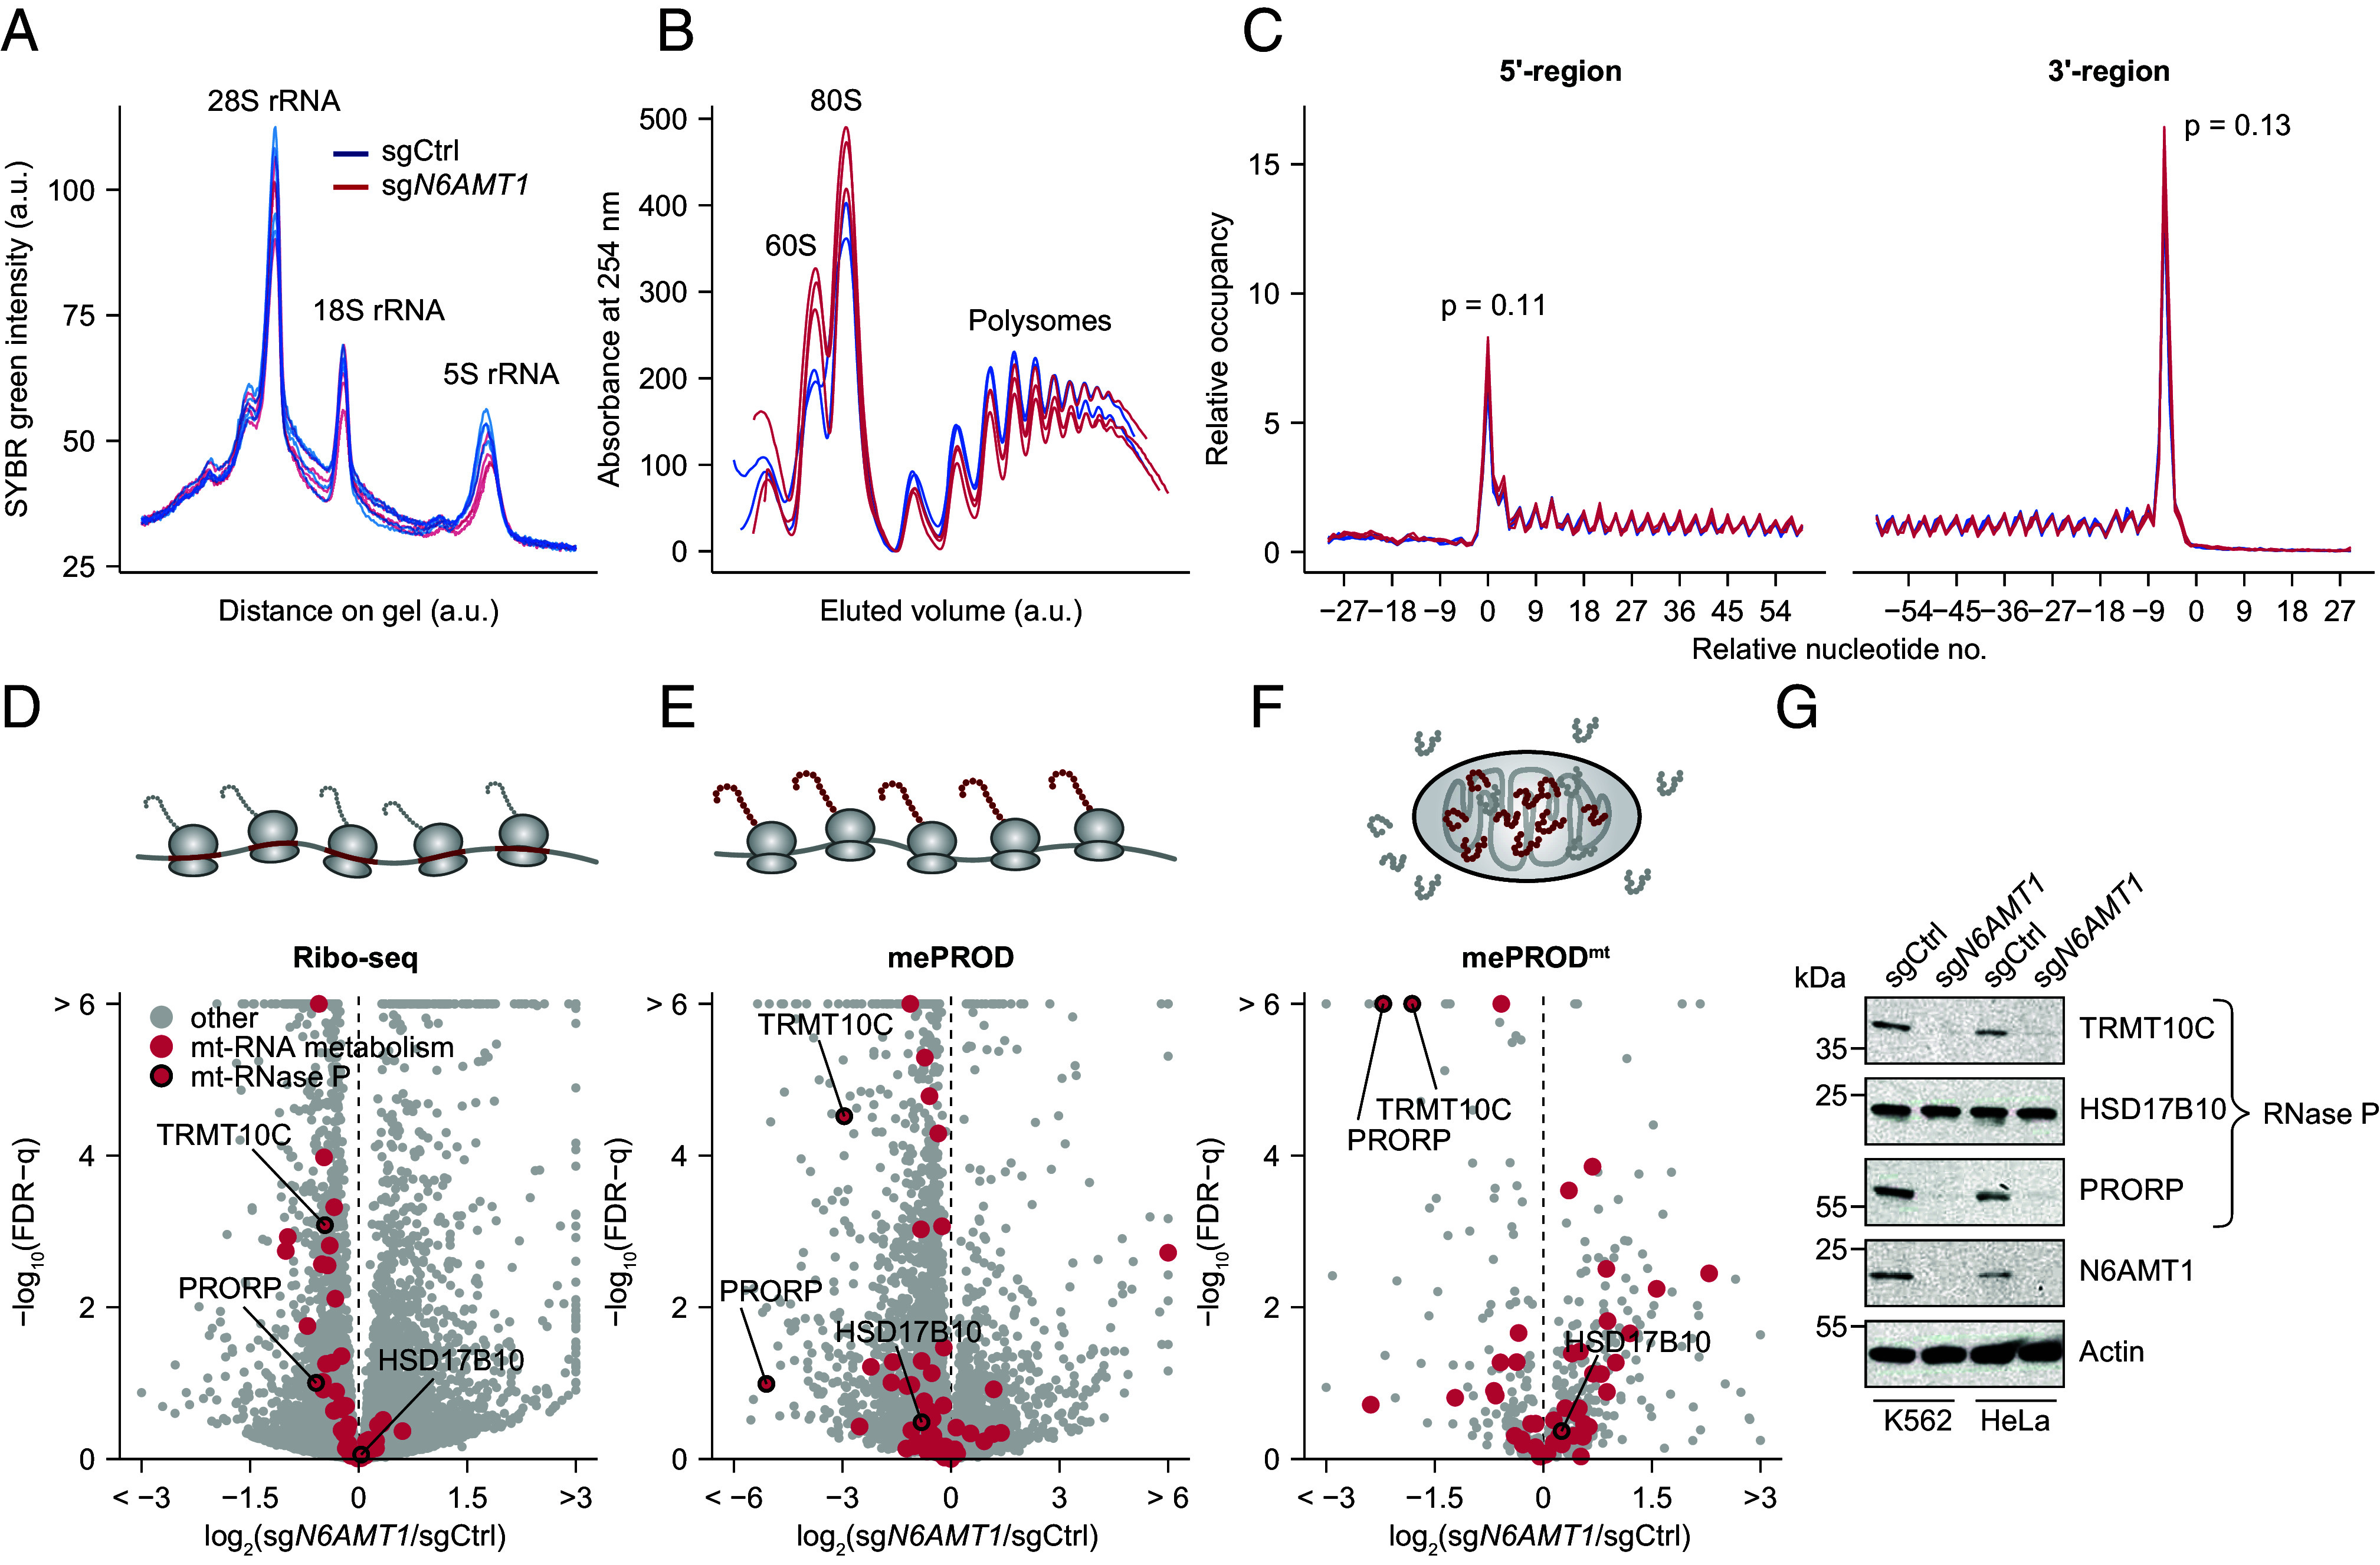
Fig. 2.

Cytosolic translation of the mt-RNA processing machinery is reduced in N6AMT1-depleted cells. (A) Quantification of RNA agarose gel (shown in SI Appendix, Fig. S2A) comparing control (sgCtrl) to N6AMT1-depleted (sgN6AMT1) K562 cells 10 d post-sgRNA transduction (n = 4 independent lentiviral infections per condition). Each curve represents the SYBR-green intensity across one lane, with the major rRNA peaks indicated. (B) Polysome analysis of control and N6AMT1-depleted K562 cells (n = 2-3 lentiviral infections) 10 d post-sgRNA transduction. Elution volumes are normalized to the 80S peak and the maximal polysome peak to allow direct comparisons between replicates. (C) Metagene analysis of control and N6AMT1-depleted K562 cells 10 d post-sgRNA transduction detected by ribosome profiling (Ribo-Seq). Curves represent ribosome-protected fragments at the indicated nucleotide positions relative to the total number of ribosome-protected fragments (n = 3 independent lentiviral infections per condition, based on 9,600 transcripts). P-values were obtained by Student’s t tests of the 5′ and 3′ peaks, respectively. (D) Transcript ribosome occupancy of 10,793 transcripts detected by ribosome profiling (Ribo-Seq) in N6AMT1-depleted K562 as compared to control cells. n = 3 independent lentiviral transduction per condition. (E and F) Translatome analysis using multiplexed enhanced protein dynamics (mePROD; 4,079 proteins) proteomics (E) and global mitochondrial protein import proteomics (mePRODmt; 495 proteins) (F) in N6AMT1-depleted K562 as compared to control cells. n = 4 independent lentiviral transduction per condition. (G) Protein immunoblot showing mitochondrial RNase P subunit protein levels in control and N6AMT1-depleted K562 and HeLa cells, with antibodies targeting TRMT10C (MRPP1), HSD17B10 (MRPP2), and PRORP (MRPP3).
