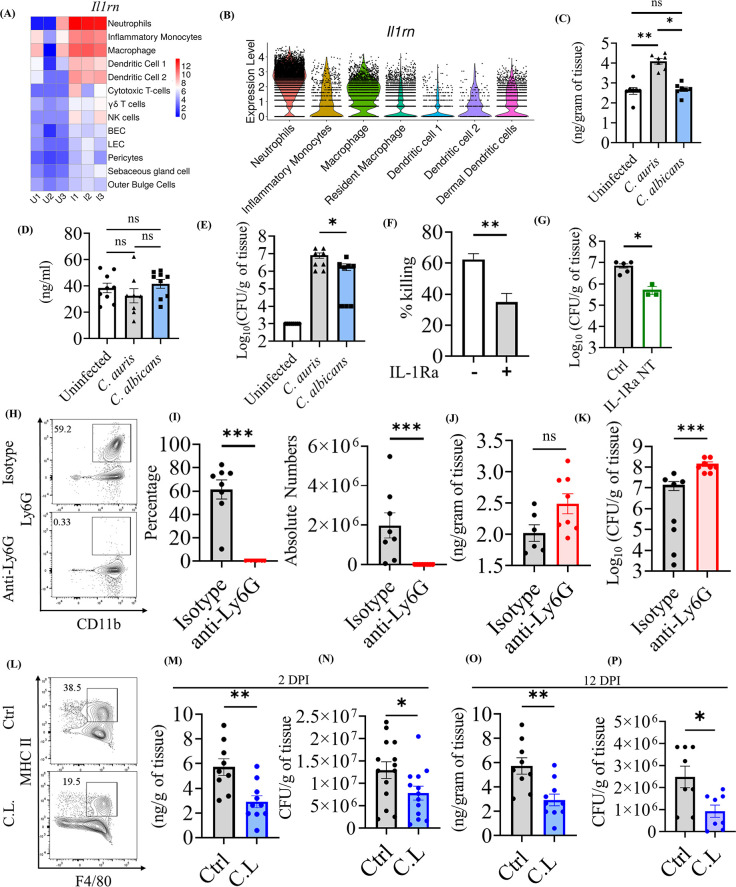
Fig 5. C. auris induces IL-1Ra in macrophages to decrease the neutrophil function in the skin.
(A) Heatmap represents the expression of Il1rn in the cell types (y-axis) between the infected and uninfected groups. The normalized gene counts were plotted in the heatmap, and the scale indicates red for high, blue for low, and white for moderate expression in the samples. Each column represents a different sample. (B) The violin plot depicts the scaled count of Il1rn in myeloid subsets from both uninfected and infected samples. The scaled count were normalized using SCTransform method. IL-1Ra levels in the (C) skin and (D) serum of mice after 3 DPI of C. auris AR0387 or C. albicans SC5314 (n = 8–10 mice/group). Uninfected mice received 100 μL of 1X PBS on the day of infection. (E) Fungal burden in the skin tissue of indicated mice on 3 DPI of C. auris AR0387 or C. albicans SC5314 (n = 8–10 mice/group). Uninfected mice received 100 μL of 1X PBS on the day of infection. (F) The bar graph represents the neutrophil-killing activity of C. auris AR0387 in the presence and absence of recombinant IL-1Ra. (G) Skin fungal burden of the mice groups injected with neutralizing anti-mouse IL-1Ra monoclonal antibody or 100 μl of 1X PBS after 3 DPI of C. auris AR0387 in the murine skin. (n = 3–5 mice/group) (H-K) Quantification of IL-1Ra level and fungal burden in mice injected with anti-Ly6G antibody and Rat IgG2a isotype control (Isotype) for neutrophil depletion after 2 DPI of C. auris AR0387 (n = 6–8 mice/group). H) Representative flow plots and I) percentage and absolute number of CD11b+ Ly6G+ neutrophils in the infected skin tissue of mice injected with anti-Ly6G antibody or Rat IgG2a isotype control (Isotype) antibody. (J) IL-1Ra level and (K) CFU were determined from the homogenate of infected skin tissue. (L-O) Measurement of IL-1Ra production and fungal burden in clodrosome (C.L) and 1X PBS (Ctrl) injected mice groups for macrophage depletion after 2 DPI of C. auris AR0387 (n = 9–10 mice/group). (L) Representative flow plots of F4/80+ MHCII+ macrophage in the infected skin tissue of mice injected with clodrosome (C.L) or 1X PBS (Ctrl) injected mice groups. (M) IL-1Ra level and (N) CFU determined from the homogenate of infected skin tissue from 2 DPI of C. auris 0387 (n = 12 mice/group).(O) IL-1Ra level and (P) CFU determined from the homogenate of infected skin tissue from 12 DPI of C. auris 0387 (n = 8–10 mice/group). Error bars represent mean ± SEM. * p < 0.05, ** p <0.01, *** p <0.001, **** p <0.0001, NS, non-significant. Statistical significances were calculated using Mann–Whitney U. Abbreviations–DPI, days post-infection; C.L, clodrosome.

