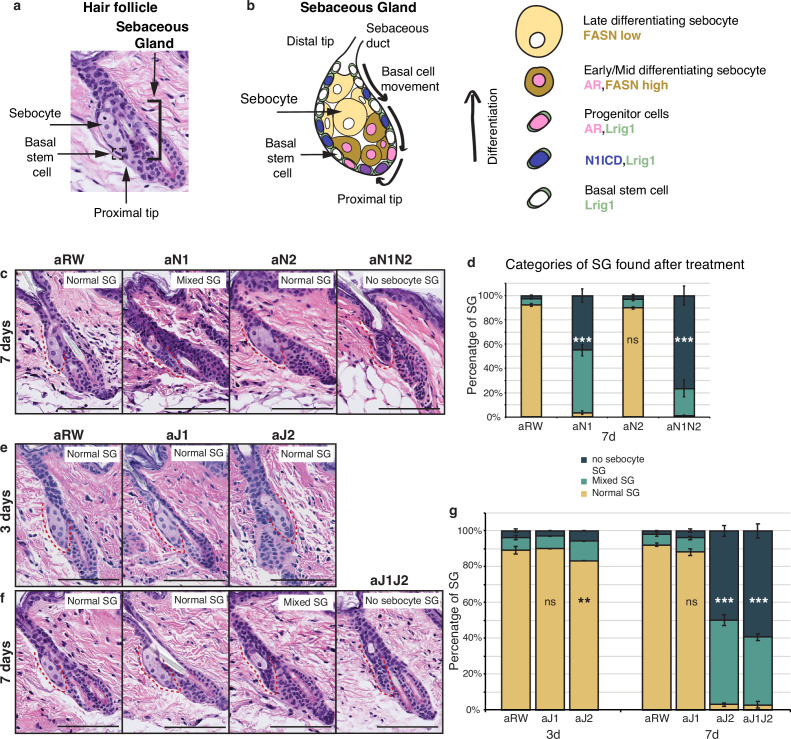
Figure 1. Jag2 is the dominant ligand involved in regulating sebocyte differentiation.
(a) A representative image of the homeostatic hair follicle, including its associated sebaceous gland (SG). (b) A detailed schematic of the SG showing the outer basal stem cell layer encasing the differentiated sebocytes. The schematic also shows the gene expression in different regions of the SG. (c) Representative hematoxylin and eosin (H&E) images of SGs from mice (n=5 each) treated with aRW, aN1, aN2, and aN1N2, 7 d post-treatment. (d) Quantification of type of SG found after each treatment. The SGs were divided into three categories: normal SGs containing a characteristic number of sebocytes (normal SG), SGs containing a mix of sebocytes and basal-like cells (mixed SG), and SGs containing no sebocytes and only basal-like cells (no sebocyte SG). For (c), (e), and (f), each SG panel is labeled with where the SG is normal, mixed, or no sebocyte SG. p-values: aN1=2.02E-123, aN2=0.426, aN1N2=3.85E-114. Total n of SGs quantified per treatment: aRW = 425, aN1=298, aN2=343, aN1N2=217. (e) Representative H&E images of SGs from mice (n=5 each) treated with aRW, aJ1, and aJ2, 3 d post-treatment. (f) Representative H&E images of SGs from mice (n=5 each) treated with aRW, aJ1, aJ2 and aJ1J2, 7 d post-treatment. (g) Quantification of type of SG found after each treatment. 3 d: p-values: aJ1=0.409, aJ2=0.004. 7 d: p-values: aJ1=0.057, aJ2=7.61E-151, aJ1J2=6.23E-169. Total n of SGs quantified per treatment: 3 d, aRW = 851, aJ1=944, aJ2=760, 7 d, aRW = 491, aJ1=499, aJ2=388, aJ1J2=461. Chi-square test used for statistical analysis. All treatments were compared against aRW. Error bars represent SEM. Scale bars are 100 μm.


