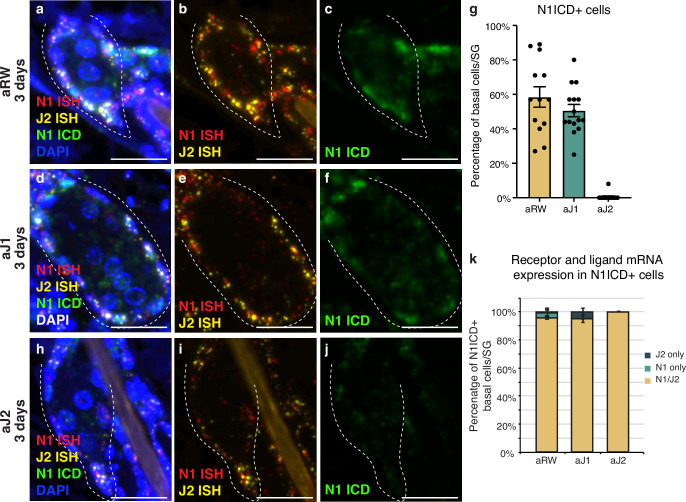
Figure 2. Notch is active in the sebaceous gland stem cells.
(a–c) Representative triple stain images for N1ICD, Notch1, and Jag2 mRNA in sebaceous glands (SGs) from mice (n=5 each) treated with aRW, 3 d post-treatment. (a) Four channels showing N1ICD, N1 ISH, J2 ISH, and DAPI. (b) Two channels showing N1 ISH and J2 ISH. (c) One channel showing N1ICD. (d-f) Representative triple stain images for N1ICD, Notch1, and Jag2 mRNA in SGs from mice (n=5 each) treated with aJ1, 3 d post-treatment. (d) Four channels showing N1ICD, N1 ISH, J2 ISH, and DAPI. (e) Two channels showing N1 ISH and J2 ISH. (f) One channel showing N1ICD. (g) Quantification of the percentage of N1ICD positive (N1ICD+) basal stem cells in SGs from mice (n=5 each) treated with aRW, aJ1, and aJ2, 3 d post-treatment. Percentage was calculated by dividing the number of N1ICD+ basal stem cells by the total number of basal stem cells in each SG. (h–j) Representative triple stain images for N1ICD, Notch1, and Jag2 mRNA in SGs from mice (n=5 each) treated with aJ2, 3 d post-treatment. (h) Four channels showing N1ICD, N1 ISH, J2 ISH, and DAPI. (i) Two channels showing N1 ISH and J2 ISH. (j) One channel showing N1ICD. (k) Quantification of what percentage of the N1ICD+ basal stem cells express both N1 ISH and J2 ISH, only N1 ISH, or only J2 ISH. (g and k) Total n of SGs quantified per treatment: aRW=13, aJ1=15, aJ2=15. Error bars represent SEM. Scale bars are 25 μm.


