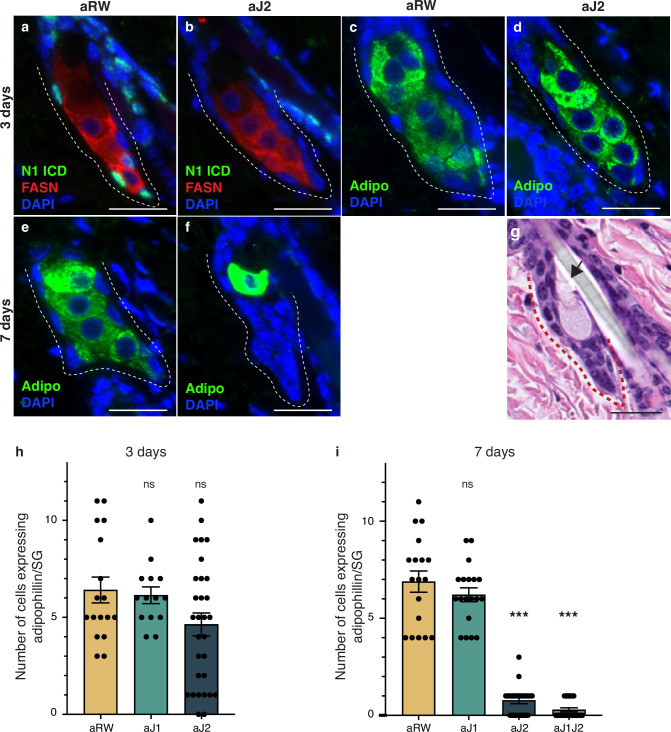
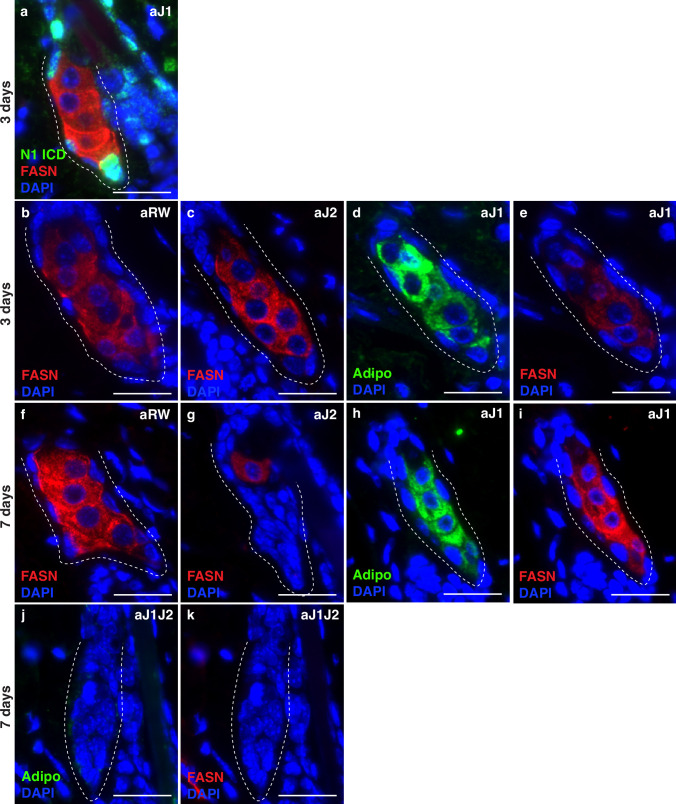
Figure 3. Loss of Notch activity in the sebaceous gland (SG) stem cells inhibits sebocyte differentiation.
(a, b) Representative co-stain images for N1ICD and fatty acid synthase (FASN) in SGs from mice (n=5 each) treated with aRW (a) and aJ2 (b), 3 d post-treatment. (c, d) Representative adipophiin staining in SGs from mice (n=5 each) treated with aRW (c) and aJ2 (d), 3 d post-treatment. (e, f) Representative adipophilin staining in SGs from mice (n=5 each) treated with aRW (e) and aJ2 (f), 7 d post-treatment. (g) A representative hematoxylin and eosin (H&E) image of an SG from mice (n=5 each) treated with aJ2, 7 d post-treatment. Arrow points to a bursting sebocyte releasing sebum into the sebaceous duct. (h) Quantification of the number of cells expressing adipophilin in each SG, 3 d post-treatment with aRW, aJ1, and aJ2. p-values: aJ1=0.749, aJ2=0.062. Total n of SGs quantified per treatment: aRW = 17, aJ1=14, aJ2=30. (i) Quantification of the number of cells expressing adipophilin in each SG, 7 d post-treatment with aRW, aJ1, aJ2, and aJ1J2. p-values: aJ1=0.301, aJ2=4.13E-14, aJ1J2=4.06E-14. Total n of SGs quantified per treatment: aRW = 18, aJ1=19, aJ2=22, aJ1J2=21. Student’s t-test used for statistical analysis. All treatments were compared against aRW. Error bars represent SEM. Scale bars are 25 μm.


